Revista Colombiana de
Tecnologías de Avanzada
Tecnologías de Avanzada
Recibido: 17 de septiembre de 2023
Aceptado: 16 de diciembre de 2023
Aceptado: 16 de diciembre de 2023
DESIGN AND IMPLEMENTATION OF SMART IRRIGATION SYSTEM FOR GREEN ROOFS CONSIDERING WARM-TROPICAL WEATHER
DISEÑO E IMPLEMENTACIÓN DE UN SISTEMA INTELIGENTE DE IRRIGACIÓN PARA TECHOS VERDES CONSIDERANDO CONDICIONES DE CLIMA CÁLIDO TROPICAL
 Ing. Andrés Cristancho-Juliao*,
PhD. German Osma-Pinto*,
PhD. César Duarte-Gualdrón*
Ing. Andrés Cristancho-Juliao*,
PhD. German Osma-Pinto*,
PhD. César Duarte-Gualdrón*
* Universidad Industrial de Santander, Facultad de Ingenierías Fisicomecánicas, Escuela de Ingenierías Eléctrica, Electrónica y de Telecomunicaciones.
Carrera 27 Calle 9 – Ciudadela Universitaria, 680002, Bucaramanga, Santander, Colombia.
Tel.: +57-6076344000.
E-mail: cristanchojuliao@gmail.com, {gealosma, cedagua}@uis.edu.co
DISEÑO E IMPLEMENTACIÓN DE UN SISTEMA INTELIGENTE DE IRRIGACIÓN PARA TECHOS VERDES CONSIDERANDO CONDICIONES DE CLIMA CÁLIDO TROPICAL
Ing. Andrés Cristancho-Juliao*,
PhD. German Osma-Pinto*,
PhD. César Duarte-Gualdrón*
* Universidad Industrial de Santander, Facultad de Ingenierías Fisicomecánicas, Escuela de Ingenierías Eléctrica, Electrónica y de Telecomunicaciones.
Carrera 27 Calle 9 – Ciudadela Universitaria, 680002, Bucaramanga, Santander, Colombia.
Tel.: +57-6076344000.
E-mail: cristanchojuliao@gmail.com, {gealosma, cedagua}@uis.edu.co
Cómo citar: Cristancho Juliao, A. M., Osma Pinto, G. A., & Duarte Gualdrón, C. A. (2023). DISEÑO E IMPLEMENTACIÓN DE UN SISTEMA INTELIGENTE DE IRRIGACIÓN PARA TECHOS VERDES CONSIDERANDO CONDICIONES DE CLIMA CÁLIDO TROPICAL. REVISTA COLOMBIANA DE TECNOLOGIAS DE AVANZADA (RCTA), 2(42), 131–140. Recuperado de https://ojs.unipamplona.edu.co/index.php/rcta/article/view/1296
Derechos de autor 2023 Revista Colombiana de Tecnologías de Avanzada (RCTA).
Esta obra está bajo una licencia internacional Creative Commons Atribución-NoComercial 4.0.

Esta obra está bajo una licencia internacional Creative Commons Atribución-NoComercial 4.0.
Abstract: The irrigation of green roofs requires active strategies such as automated irrigation systems to ensure the rational use of water. However, these systems must evolve to address green roof challenges such as horticulture and information technology integration. This paper presents the design and implementation of a smart irrigation system for the two green roofs of a university building. The irrigation system operates based on the moisture content of the substrate per zone. The monitored variables are the moisture content and the substrate temperature. The real-time behavior and historical data of the irrigation system can be visualized by a platform (web page) using the Internet of Things (IoT). Results show that the smart irrigation system improves the rational use of water, the substrate moisture content influences the substrate temperature, and the zoning operation allows the integration of different types of crops with different irrigation needs.
Keywords: Irrigation system, green roof, IoT, rational use of water.
Resumen: La irrigación de techos verdes demanda estrategias activas como sistemas automatizados de irrigación para garantizar el uso racional de agua. Sin embargo, este sistemas deben propender por atender retos de los techos verdes como la horticultura y la integración de tecnologías de la información. Este artículo presenta el diseño e implementación de un sistema inteligente de irrigación para dos techos verdes en un edificio universitario. El sistema de irrigación opera basado en la humedad del sustrato por zona. Las variables monitorizadas son humedad y temperatura del sustrato. El comportamiento en tiempo real y los datos históricos puede ser visualizados por medio de una plataforma web usando IoT. Los resultados muestran que el sistema mejora el uso racional de agua, la humedad del sustrato influye en la temperatura de éste y la operación por zona permite la integración de diversos cultivos con diferentes necesidades de irrigación.
Palabras clave: Sistema de irrigación, techo verde, uso racional del agua.
Automated irrigation systems help ensuring rational and efficient use of water, which is an essential good, and supply the correct amount of water for the growth of plants (Seidel et al. 2017). Therefore, such systems are essential for improving agricultural activities, and they apply several control approaches such as rules-based artificial intelligence (Halgamuge et al. 2021; Jha et al. 2019).
The performance of irrigation systems can be improved by integrating the Internet of Things (IoT), providing flexibility, real-time control, and communication infrastructure, and analytical techniques, which can become smart systems (Halgamuge et al. 2021; Jha et al. 2019). Wireless sensors and the IoT can be used to develop tools for monitoring and controlling crop irrigation (Kamienski et al. 2019; Muangprathub et al. 2019).
Therefore, it is promising to consider the application of IoT-based smart irrigation systems in agriculture (Kashyap et al. 2021; Phasinam et al. 2022; Rawal 2017) and green roofs (Halgamuge et al. 2021; Shaheen, Priya, and Harsha 2021), particularly considering urban horticulture, which can help to develop healthy eating and improve the physical and psychological health of citizens (George et al. 2015).
However, studies are lacking on the development of smart irrigation systems for green roofs used to cultivate several vegetable species with different water requirements.
Therefore, this study developed an IoT-based smart irrigation system for the two green roofs of a university building (Electrical Engineering Building, EEB), located in the Universidad Industrial de Santander (UIS) (Bucaramanga, Colombia). The two green roofs are divided into eight zones with different crops (horticultural, aromatic, and ornamental).
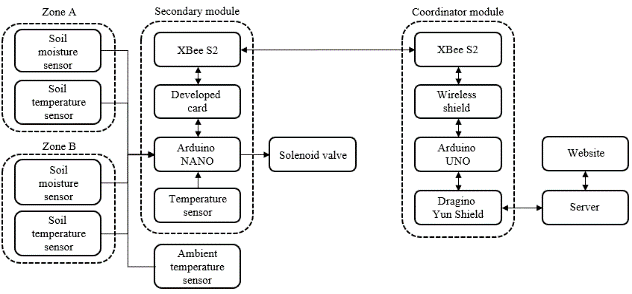
The irrigation system has a modular structure formed by a central module (coordinator) and four secondary modules, and each of the secondary modules monitors the temperature and humidity content in the substrate and controls the water supply for two zones. To achieve this, the hardware is composed of an Arduino UNO, a Dragino Yun Shield card, five XBee S2, four Arduino Nano modules, eight substrate moisture sensors, fourteen PT-100, and eight solenoid electro valves, among others.
This paper describes the design, implementation, and operation of this low-cost irrigation system, which includes manual and automatic operation modes, visualization of the historical and real-time behavior of the system, and a data storage server.
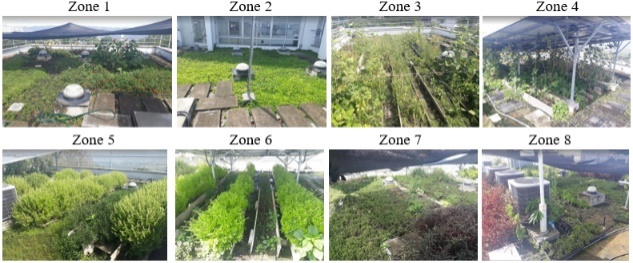
This building has two green rooftops: the first is located on the fifth floor with an area of 120 m2, and the second is the upper rooftop located on the sixth floor. The second rooftop has an area of approximately 460 m2 and an effective green area of approximately 340 m2 (excluding pedestrian paths). To ensure adequate water pressure during irrigation, the rooftops are divided into eight zones, which are irrigates in sequence.
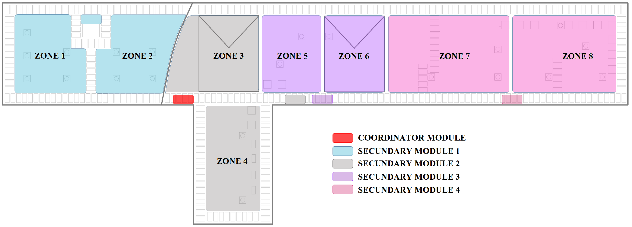
On the fifth floor (lower terrace), zones 1 and 2 have sunflower, poppy, crested lettuce, amaranth, ornamental pine, and forage peanut crops. On the sixth floor (upper terrace), zones 3 and 4 have beans, eggplants, tomatoes, and paprika; zones 5 and 6 contain mint and basil; zone 7 contains tomatoes, lemons, peppermint, basil, duranta, and guasca; and zone 8 has tomatoes, parsley, paprika, peppermint, and crested lettuce. The above zones are shown in Fig. 1.
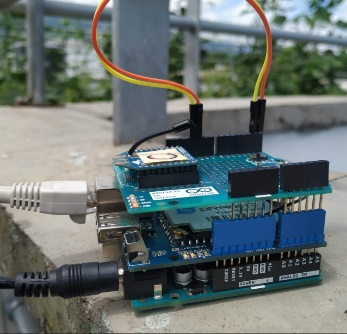
The coordinator module is a modular structure formed by the following: (i) an Arduino UNO, which receives information from the secondary modules and defines the zone to be irrigated; (ii) a Dragino Yun Shield card, which establishes Ethernet communication between the irrigation system and the server; (iii) an XBee S2 module, which establishes wireless communication between the secondary modules and the central module; and (iv) a wireless shield, which helps to integrate the XBee S2 module and the Arduino UNO card.
Similarly, the substrate moisture content is monitored using Vegetronix VH400 sensors, which allow determining the volumetric water content (VWC) of the substrate. In addition, to monitor the soil, ambient temperature, and internal temperature of the modules, PT100 sensors are used. Table 1 lists the technical specifications of the above used sensors.
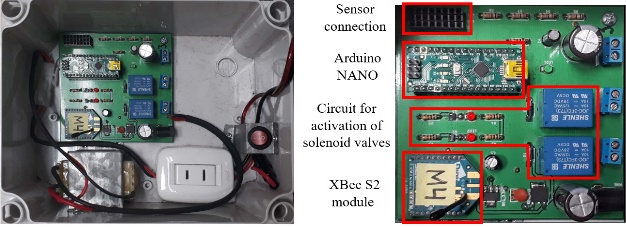
Considering the number of zones and the sensors to be used, the control system has a total of 22 analog inputs. These comprise eight substrate moisture sensors, eight PT-100 for substrate temperature, four PT-100 for internal temperature of the secondary modules, and two PT-100 for ambient temperature. The control system also has eight digital outputs (eight solenoid valves, one per zone). This supports the use of an Arduino NANO card for secondary modules, because this card has eight analog inputs. Table 2 lists the sensors used in each secondary module.
The central module or the coordinator controls the entire system and receives configuration information from the server and data from the secondary modules via the XBee S2 modules, as shown in Fig. 3.
Each module handles information from two zones. Fig. 5 shows the locations of the modules in the green zone of the fifth floor and the upper terrace as well as the zones controlled by each module.
In addition, the platform allows the administration of the irrigation system by configuring the control parameters, such as the minimum and maximum levels of the soil moisture in each area, as well as the time required to send data to the server.
It is noteworthy that the system can register events such as rainfall indirectly from the increase in the VWC levels and the decrease in the soil temperature, despite the turning off of the solenoid valves. For the considered day, these variations occurred at 9:14 p.m.
The substrate layer presents a continuous change in the VWC. This variation is due to the path of the water from the surface to where it is applied to the lower part of the substrate, as well as by the evaporation of water caused by ambient temperature.
The system starts registering the increase in the VWC level approximately 2–3 min after the activation of the solenoid valve.
Fig. 8 shows the increasing variation in the VWC by considering the same time instant, which allows understanding the transient water accumulation in the soil. In general, the irrigation time required by each zone varies between 9 and 12 min, and the registration of such a variation can take up to approximately 15 min.
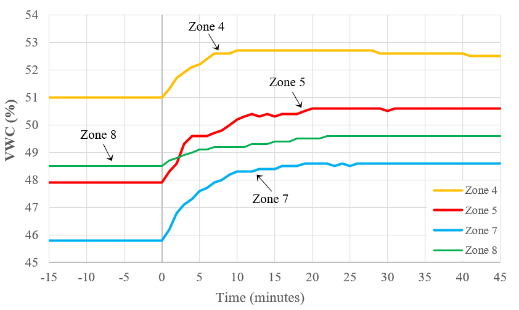
Fig. 10 presents boxplots for characterizing the populations of the VWC soil of zones 4, 5, 7, and 8 under two conditions: without rainfall (A: data from 12:00 a.m. to 9:13 p.m.) and with rainfall (B: data from 12:00 a.m. to 11:59 p.m.). The A-boxplots indicate the permissible values of the VWC that define the operation of the irrigation system. The B-boxplots present the possible VWC values that a zone can experiment with. The system cannot control the increase in the soil moisture caused by rainfall; however, it can monitor rainfall impact on the soil. The VWC depends on the retention capacity, soil depth, and substrate properties (Cook and Larsen 2021).
The ambient temperature strongly influences zones 1 and 7, which could be due to wrong location of the sensor (partial exposure to the ambient) or the reduced thickness of the soil. The plant roots from these zones experienced a temperature variation between 18 °C and 33 °C (ΔT ≈15 °C), which must be studied to determine if it causes thermal stress and affects the plant growth.
In comparison, the soil temperatures of zones 3, 5, 6, and 8 vary only between 22 °C and 26 °C, which ensures stable conditions for the growth of plants, specifically with temperature differences of 2.9 °C, 3.0 °C, and 4.1 °C, respectively.
The inner temperature of the water valve box varied between 16.3 °C and 34.4 °C (ΔT = 18.1 °C), reflecting the operating conditions of the secondary module and the solenoid valve.
Fig. 13 shows the difference between the soil temperature and the ambient temperature. Zones 3, 5, 6, and 8 provide thermal isolation to the concrete roof; the soils are between 3 °C and 5 °C above the ambient temperature from 12 a.m. to 6 a.m. and achieve a temperature reduction of up to 9 °C during sun-hours.
Fig. 7 shows that the rainfall (9:14 p.m.) reduces the air temperature from approximately 23 °C to 19 °C in less than 3 min; nevertheless, the temperatures of zones 3, 5, 6, and 8 only fall below 1 °C after 15 min.
Crop irrigation is relevant to crop productivity; therefore, it is necessary to ensure that the irrigation system is established based on the plant species and the favorable moisture level (Phasinam et al. 2022).
The irrigation time of each zone is affected by factors such as the consistency of the substrate and the separation between the drip lines. To reduce the irrigation time, central sprinklers are installed in zones 7 and 8.
This irrigation system uses sensors and the IoT, which allows interaction between a physical green roof and the Internet platform; in addition, the collected data help characterize the evolution of the soil and the plants.
An interface was developed that allows configuration of the operating parameters of the irrigation system, visualization of historical data, and obtaining the real-time behavior of the system operation using a web page. Additionally, the system issues a series of alerts that warn of a possible malfunction caused by a VWC value that exceeds the reasonable range or by an excess irrigation time.
Although some studies (Morillo et al. 2015; Nolz et al. 2016) have suggested that correct monitoring of the soil moisture level requires the installation of moisture sensors at different depths, this is infeasible for extensive green roofs, whose substrate thickness varies mostly between 10 and 20 cm.
During a follow-up study to determine the system operating limit values, it was found that it is impossible to generalize the locations of the moisture sensors. This is because their reading depends on factors such as the depth of the substrate and its consistency.
The above data obtained by the system allow inferring the health and effectiveness of a green roof for the growth of crops and the thermal isolation of buildings.
Although the system is designed based on the green roof conditions of the EEB, it can be implemented in greenhouses and orchards.
Monitoring the temporary variation in the VWC in the substrate of the zones allows adequate management of the irrigation system, thereby improving water use. It is also found that the VWC has a significant effect on the overall performance of the system, influencing its operation and the duration of irrigation in each zone. The VWC curves exhibit dynamic behavior, which is affected by various factors, including the soil heterogeneity and the crop characteristics. The above is directly related to the frequency of irrigation activation in the areas; the latter is also altered by climatic factors.
George, Daniel R., Liza S. Rovniak, Jennifer L. Kraschnewski, Ryan Hanson, and Christopher N. Sciamanna. 2015. “A Growing Opportunity: Community Gardens Affiliated with US Hospitals and Academic Health Centers.” Preventive Medicine Reports 2:35–39.
Halgamuge, Malka N., Alexe Bojovschi, Peter M. J. Fisher, Tu C. Le, Samuel Adeloju, and Susan Murphy. 2021. “Urban Forestry & Urban Greening Internet of Things and Autonomous Control for Vertical Cultivation Walls towards Smart Food Growing : A Review.” 61(March).
Jha, Kirtan, Aalap Doshi, Poojan Patel, and Manan Shah. 2019. “A Comprehensive Review on Automation in Agriculture Using Artificial Intelligence.” Artificial Intelligence in Agriculture 2:1–12.
Kamienski, Carlos, Juha Pekka Soininen, Markus Taumberger, Ramide Dantas, Attilio Toscano, Tullio Salmon Cinotti, Rodrigo Filev Maia, and André Torre Neto. 2019. “Smart Water Management Platform: IoT-Based Precision Irrigation for Agriculture.” Sensors (Switzerland) 19(2).
Kashyap, Pankaj Kumar, Sushil Kumar, Ankita Jaiswal, Mukesh Prasad, and Amir H. Gandomi. 2021. “Towards Precision Agriculture: IoT-Enabled Intelligent Irrigation Systems Using Deep Learning Neural Network.” IEEE Sensors Journal 21(16):17479–91.
Morillo, J. García, M. Martín, E. Camacho, J. A. Rodrígue. Díaz, and P. Montesinos. 2015. “Toward Precision Irrigation for Intensive Strawberry Cultivation.” Agricultural Water Management 151:43–51.
Muangprathub, Jirapond, Nathaphon Boonnam, Siriwan Kajornkasirat, Narongsak Lekbangpong, Apirat Wanichsombat, and Pichetwut Nillaor. 2019. “IoT and Agriculture Data Analysis for Smart Farm.” Computers and Electronics in Agriculture 156(June 2018):467–74.
Nolz, R., P. Cepuder, J. Balas, and W. Loiskandl. 2016. “Soil Water Monitoring in a Vineyard and Assessment of Unsaturated Hydraulic Parameters as Thresholds for Irrigation Management.” Agricultural Water Management 164:235–42.
Osma-Pinto, G., and G. Ordóñez-Plata. 2019. “Measuring Factors Influencing Performance of Rooftop PV Panels in Warm Tropical Climates.” Solar Energy 185.
Osma-Pinto, German, and Laura Amado-Duarte. 2021. “Selection of the Control Alternative with the Minimum Energy Consumption for the Hybrid Illumination System of Inner Spaces.” Journal of Building Engineering 35(April 2020):102046.
Paraskevopoulou, Angeliki T., Panagiotis Tsarouchas, Paraskevi A. Londra, and Athanasios P. Kamoutsis. 2020. “The Effect of Irrigation Treatment on the Growth of Lavender Species in an Extensive Green Roof System.” Water 12(863):1–18.
Phasinam, Khongdet, Thanwamas Kassanuk, Priyanka P. Shinde, Chetan M. Thakar, Dilip Kumar Sharma, Khaja Mohiddin, and Abdul Wahab Rahmani. 2022. “Application of IoT and Cloud Computing in Automation of Agriculture Irrigation.” Journal of Food Quality 2022:1–8.
Rawal, Srishti. 2017. “IOT Based Smart Irrigation System.” International Journal of Computer Applications 159(8):7–11.
Seidel, S. J., S. Werisch, N. Schütze, and H. Laber. 2017. “Impact of Irrigation on Plant Growth and Development of White Cabbage.” Agricultural Water Management 187:99–111.
Shaheen, Sk Safiya, S. Bhagya Priya, and S. Harsha. 2021. “Smart Irrigation System Based on IoT.” International Journal of Trend in Innovative Research (IJTIIR) 3(3):28–31.
Susca, Tiziana. 2019. “Green Roofs to Reduce Building Energy Use? A Review on Key Structural Factors of Green Roofs and Their Effects on Urban Climate.” Building and Environment 162.
Zluwa, Irene, and Ulrike Pitha. 2021. “The Combination of Building Greenery and Photovoltaic Energy Production — A Discussion of Challenges and Opportunities in Design.” Sustainability 13(1537):1–29.
Keywords: Irrigation system, green roof, IoT, rational use of water.
Resumen: La irrigación de techos verdes demanda estrategias activas como sistemas automatizados de irrigación para garantizar el uso racional de agua. Sin embargo, este sistemas deben propender por atender retos de los techos verdes como la horticultura y la integración de tecnologías de la información. Este artículo presenta el diseño e implementación de un sistema inteligente de irrigación para dos techos verdes en un edificio universitario. El sistema de irrigación opera basado en la humedad del sustrato por zona. Las variables monitorizadas son humedad y temperatura del sustrato. El comportamiento en tiempo real y los datos históricos puede ser visualizados por medio de una plataforma web usando IoT. Los resultados muestran que el sistema mejora el uso racional de agua, la humedad del sustrato influye en la temperatura de éste y la operación por zona permite la integración de diversos cultivos con diferentes necesidades de irrigación.
Palabras clave: Sistema de irrigación, techo verde, uso racional del agua.
1. INTRODUCTION
Currently, the rapid population growth is reducing green areas in cities. Thus, green roofs are useful alternatives to mitigate the above negative impact. Such type of roofs provide benefits such as air pollution control, improvement in the energy performance of buildings, decrease in the internal temperature of buildings in hot weather (Susca 2019), (Osma-Pinto and Ordóñez-Plata 2019), and development of urban agriculture (Paraskevopoulou et al. 2020). Green spaces are rapidly increasing in cities to maintain a clean and green atmosphere (Halgamuge et al. 2021). These benefits can be enhanced by integrating irrigation systems on rooftops (Cook and Larsen 2021; Zluwa and Pitha 2021).Automated irrigation systems help ensuring rational and efficient use of water, which is an essential good, and supply the correct amount of water for the growth of plants (Seidel et al. 2017). Therefore, such systems are essential for improving agricultural activities, and they apply several control approaches such as rules-based artificial intelligence (Halgamuge et al. 2021; Jha et al. 2019).
The performance of irrigation systems can be improved by integrating the Internet of Things (IoT), providing flexibility, real-time control, and communication infrastructure, and analytical techniques, which can become smart systems (Halgamuge et al. 2021; Jha et al. 2019). Wireless sensors and the IoT can be used to develop tools for monitoring and controlling crop irrigation (Kamienski et al. 2019; Muangprathub et al. 2019).
Therefore, it is promising to consider the application of IoT-based smart irrigation systems in agriculture (Kashyap et al. 2021; Phasinam et al. 2022; Rawal 2017) and green roofs (Halgamuge et al. 2021; Shaheen, Priya, and Harsha 2021), particularly considering urban horticulture, which can help to develop healthy eating and improve the physical and psychological health of citizens (George et al. 2015).
However, studies are lacking on the development of smart irrigation systems for green roofs used to cultivate several vegetable species with different water requirements.
Therefore, this study developed an IoT-based smart irrigation system for the two green roofs of a university building (Electrical Engineering Building, EEB), located in the Universidad Industrial de Santander (UIS) (Bucaramanga, Colombia). The two green roofs are divided into eight zones with different crops (horticultural, aromatic, and ornamental).
The irrigation system has a modular structure formed by a central module (coordinator) and four secondary modules, and each of the secondary modules monitors the temperature and humidity content in the substrate and controls the water supply for two zones. To achieve this, the hardware is composed of an Arduino UNO, a Dragino Yun Shield card, five XBee S2, four Arduino Nano modules, eight substrate moisture sensors, fourteen PT-100, and eight solenoid electro valves, among others.
This paper describes the design, implementation, and operation of this low-cost irrigation system, which includes manual and automatic operation modes, visualization of the historical and real-time behavior of the system, and a data storage server.
2. METHODOLOGY
2.1 Vegetable cover
The EEB is a green building pilot project whose objective is to study the performance of several green strategies to reduce energy and freshwater use considering a warm-tropical climate. The UIS is located in the city of Bucaramanga (Colombia) at 960 m above sea level, with an average daily temperature of 24 °C and an average maximum temperature of 31 °C (Osma-Pinto and Amado-Duarte 2021).This building has two green rooftops: the first is located on the fifth floor with an area of 120 m2, and the second is the upper rooftop located on the sixth floor. The second rooftop has an area of approximately 460 m2 and an effective green area of approximately 340 m2 (excluding pedestrian paths). To ensure adequate water pressure during irrigation, the rooftops are divided into eight zones, which are irrigates in sequence.
On the fifth floor (lower terrace), zones 1 and 2 have sunflower, poppy, crested lettuce, amaranth, ornamental pine, and forage peanut crops. On the sixth floor (upper terrace), zones 3 and 4 have beans, eggplants, tomatoes, and paprika; zones 5 and 6 contain mint and basil; zone 7 contains tomatoes, lemons, peppermint, basil, duranta, and guasca; and zone 8 has tomatoes, parsley, paprika, peppermint, and crested lettuce. The above zones are shown in Fig. 1.
2.2 Hardware description
The designed system consists of a central module and four secondary modules. The central module controls the operation of the irrigation system. The secondary modules acquire the monitored data and execute the actions from the central module. Fig. 2 shows a scheme of the irrigation system functionality as well as the data communication between components.The coordinator module is a modular structure formed by the following: (i) an Arduino UNO, which receives information from the secondary modules and defines the zone to be irrigated; (ii) a Dragino Yun Shield card, which establishes Ethernet communication between the irrigation system and the server; (iii) an XBee S2 module, which establishes wireless communication between the secondary modules and the central module; and (iv) a wireless shield, which helps to integrate the XBee S2 module and the Arduino UNO card.
Fig. 1. Irrigation zones.
Fig.2. Diagram of communication of components and operation of irrigation system.
Each secondary module performs the following functions: reading data from the sensors of two zones, sending and receiving data from the central module, and activating or deactivating the solenoid valves. To achieve the above, the secondary modules include the following: (i) an Arduino NANO card, which manages the reading the data from sensors and executes the commands from the central module, (ii) an XBee S2 module for wireless communication, and (iii) a developed coupling card with a 9 Vdc power supply, which reads the data from the sensors of two zones, activates or deactivates the solenoid valves of these zones, and couples the Arduino NANO card, the XBee S2 module, and their power supply.Similarly, the substrate moisture content is monitored using Vegetronix VH400 sensors, which allow determining the volumetric water content (VWC) of the substrate. In addition, to monitor the soil, ambient temperature, and internal temperature of the modules, PT100 sensors are used. Table 1 lists the technical specifications of the above used sensors.
Considering the number of zones and the sensors to be used, the control system has a total of 22 analog inputs. These comprise eight substrate moisture sensors, eight PT-100 for substrate temperature, four PT-100 for internal temperature of the secondary modules, and two PT-100 for ambient temperature. The control system also has eight digital outputs (eight solenoid valves, one per zone). This supports the use of an Arduino NANO card for secondary modules, because this card has eight analog inputs. Table 2 lists the sensors used in each secondary module.
Table 1: Technical specifications of the sensors used.
| Sensor | VH-400 | PT-100 |
|---|---|---|
| Measured data | Soil moisture | Soil temperature, ambient, and internal module |
| Output | 0–3 V | 0.4–4.4 V |
| Range | 0–60% VWC | −20 to 105 °C |
| Resolution | 0.1% | 0.1 °C |
| Accuracy | ±2% a 25 °C | ±0.15 °C |
| Supply voltage range | 3.5–20 Vdc | - |
Table 2. Sensors by each secondary module.
| Sensor | Secondary module | |||
|---|---|---|---|---|
| 1 | 2 | 3 | 4 | |
| Soil moisture (VH400) | 2 | 2 | 2 | 2 |
| Substrate temperature (PT100) | 2 | 2 | 2 | 2 |
| Ambient temperature (PT100) | 1 | 0 | 1 | 0 |
| Inner module temperature (PT100) | 1 | 1 | 1 | 1 |
2.3 Operating instructions
The irrigation system has automatic and manual operation modes that are used via a website. The automatic mode operates according to the soil moisture content of each zone. In the manual mode, users can activate the irrigation of areas according to their criteria. However, the irrigation of the areas is conducted sequentially.The central module or the coordinator controls the entire system and receives configuration information from the server and data from the secondary modules via the XBee S2 modules, as shown in Fig. 3.
Fig. 3. Components of central module.
The central module enables a solenoid valve to start irrigation in the corresponding area. In general, the coordinator performs the following: (i) receives data from the modules, (ii) works in an operation that is programmed on the server, (iii) sends information to the modules, (iv) sends and receives data from the server, and (v) reallocates variables. The secondary modules receive information from the sensors of each zone using the developed card. The acquired data are sent to the central module via wireless communication by the XBee S2 module, and the solenoid valve is activated or deactivated depending on the soil moisture and the irrigation availability. Fig. 4 shows a secondary module assembled with the developed card. Additionally, each secondary module outputs at 24 Vac (transformer) and 120 Vac (electrical outlet) to supply the solenoid valve and other components, respectively.
Fig. 4. Secondary module.
The system has two types of communication: wireless and Ethernet. Wireless communication allows information exchange between the secondary and central modules via the XBee S2 modules. Dragon Shield Yun establishes an Ethernet communication between the system and the server; this card is configured to connect to a specific Internet network, and it provides a routine that allows writing/reading data on the server.Each module handles information from two zones. Fig. 5 shows the locations of the modules in the green zone of the fifth floor and the upper terrace as well as the zones controlled by each module.
Fig. 5. Location of control system modules.
2.4 Irrigation network
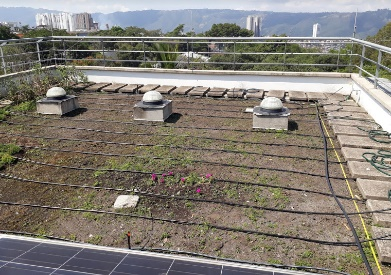
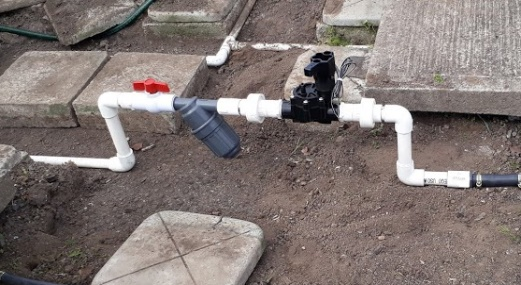
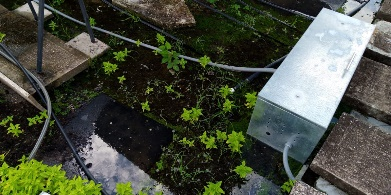
In each zone, the irrigation network has a passage box (galvanized steel with thermal insulation) that contains a manual stopcock, mesh filter, and Rain Bird solenoid electro valve. A 3/4" polyethylene handle extends out of each box, which has branches every 0.5 m with a 16 mm drip line with droppers every 0.5 m, forming a 0.5 m × 0.5 m drip net. To reduce dripping time, a central sprinkler is also installed in each zone. Figs. 6(a) and (b) show a part of the irrigation network and the elements of a passage box, respectively.
(a) Laying of the irrigation network.
(b) Water pipe ball valve, water filter, and water electro valve.
(c) Water valve box.
Fig. 6. The installation process of the irrigation network.
Fig. 6. The installation process of the irrigation network.
2.5 Display and configuration
The irrigation system has a platform with access to the Internet. The system interface allows configuration of the system operation, visualization of variables (moisture level, soil temperature of each zone, internal temperatures of the control modules, ambient temperature, and condition of the solenoid valves), and downloading data for a specific period of days.In addition, the platform allows the administration of the irrigation system by configuring the control parameters, such as the minimum and maximum levels of the soil moisture in each area, as well as the time required to send data to the server.
3. RESULTS
3.1 Operation of the irrigation system
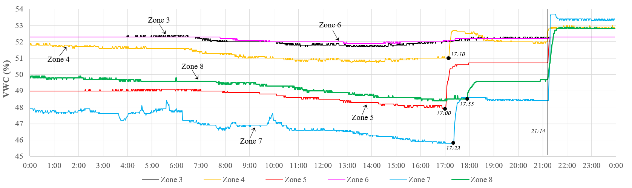
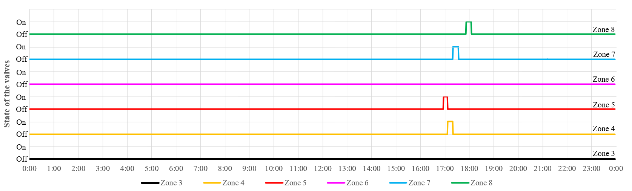
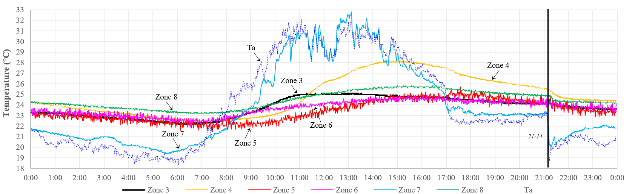
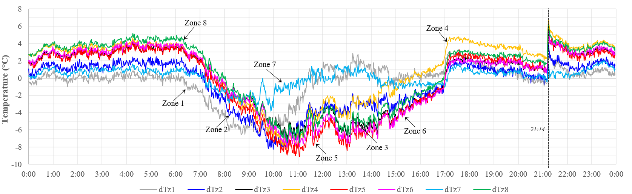
The website created for this system allows consulting its operation and downloading of data for conducting complementary analysis. Figs. 7(a) and (b) show the daily behavior of the soil moisture level and states of the solenoid valves of each zone (3–8) from the upper terrace for a typical day, respectively. Fig. 7(c) shows the soil temperatures for these six zones.
(a) Soil moisture level of each zone.
(b) States of the solenoid valves.
(c) Temperatures, of the soil of each zone, environment, and internal of the modules.
Fig. 7. Daily monitoring of the irrigation system.
On the selected day, the system detected low VWC levels in zones 4, 5, 7, and 8, and subsequently activated the corresponding valves at 5:07 p.m., 4:57 p.m., 5:20 p.m., and 5:52 p.m., respectively. Fig. 7. Daily monitoring of the irrigation system.
It is noteworthy that the system can register events such as rainfall indirectly from the increase in the VWC levels and the decrease in the soil temperature, despite the turning off of the solenoid valves. For the considered day, these variations occurred at 9:14 p.m.
3.2 Moisture
Owing to the diversity of the soil textures present in the studied zones and their respective crops, it was necessary to establish specific limits of the VWC to each zone, based on the requirements of the plant species.The substrate layer presents a continuous change in the VWC. This variation is due to the path of the water from the surface to where it is applied to the lower part of the substrate, as well as by the evaporation of water caused by ambient temperature.
The system starts registering the increase in the VWC level approximately 2–3 min after the activation of the solenoid valve.
Fig. 8 shows the increasing variation in the VWC by considering the same time instant, which allows understanding the transient water accumulation in the soil. In general, the irrigation time required by each zone varies between 9 and 12 min, and the registration of such a variation can take up to approximately 15 min.
Fig. 8. Increasing the soil moisture due to irrigation.
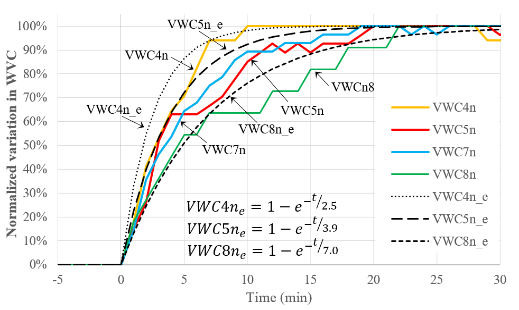
Eq. (1) calculates the normalized behavior of the VWC in each zone (VWCn), where t1 is the time when the solenoid valve is activated (transient start), t2 is the time when the VWC becomes stable (transient end), VWCt is the VWC between t1 and t2, VWCt1 is VWC at t1, and VWCt2 is the VWC at t2.
\[ \text{VWC}_n = \left( \frac{\text{VWC}_t - \text{VWC}_{t1}}{\text{VWC}_{t2} - \text{VWC}_{t1}} \right) \times 100\% \hspace{1cm} (1)\]
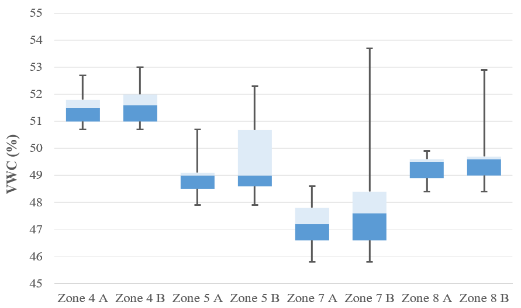
Fig. 9 shows the VWCn for zones 4, 5, 7, and 8, which allows comparing them, specifically showing a transient water storage in the soil, similar to a capacitor charging. It is possible to estimate VWCn using the function, \( \text{VWC}_n = 1 - e^{-t/\tau} \), where τ is between 2.5 and 9.0 min.Fig. 10 presents boxplots for characterizing the populations of the VWC soil of zones 4, 5, 7, and 8 under two conditions: without rainfall (A: data from 12:00 a.m. to 9:13 p.m.) and with rainfall (B: data from 12:00 a.m. to 11:59 p.m.). The A-boxplots indicate the permissible values of the VWC that define the operation of the irrigation system. The B-boxplots present the possible VWC values that a zone can experiment with. The system cannot control the increase in the soil moisture caused by rainfall; however, it can monitor rainfall impact on the soil. The VWC depends on the retention capacity, soil depth, and substrate properties (Cook and Larsen 2021).
Fig. 9. Behavior of the normalized soil moisture due to irrigation.
Fig. 10. Boxplots of the soil moisture for zones 4, 5, 7, and 8 with and without the effect of the rainfall during one day.
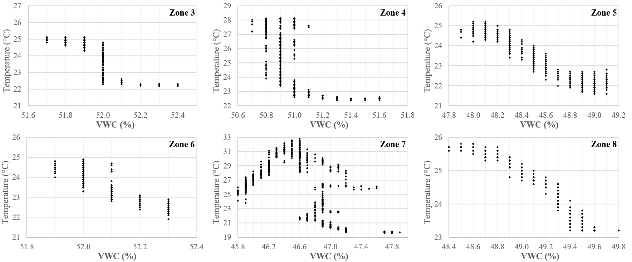
The data collected by the system also allow analyzing the relation between the soil moisture and the soil temperature, as shown in Fig. 11. In general, the soil temperature decreases when the soil moisture increases, which occurs in zones 3, 5, 6, and 8. Zones 4 and 7 do not present this trend, which merits a complementary analysis.3.3 Temperature of soil
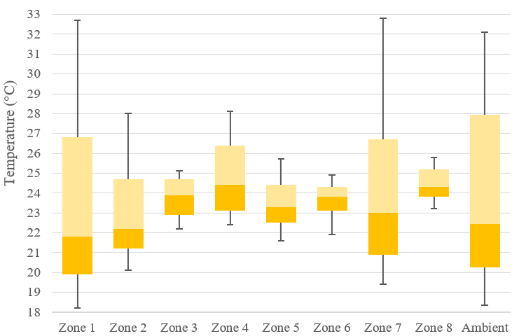
The acquired soil temperature data help to understand the green roof performance of the EEB and the conditions of the roots of the plants. Fig. 7(c), Fig. 12, and Table III present the behavior of the soil temperature for a day. Table III lists the values (minimum, average, maximum, and differences) of the soil temperature for the eight zones, boxes, and ambient conditions.The ambient temperature strongly influences zones 1 and 7, which could be due to wrong location of the sensor (partial exposure to the ambient) or the reduced thickness of the soil. The plant roots from these zones experienced a temperature variation between 18 °C and 33 °C (ΔT ≈15 °C), which must be studied to determine if it causes thermal stress and affects the plant growth.
Figure 11. Relations between soil moisture and soil temperature for zones 3–8.
Fig. 12. Boxplots of the soil temperature and ambient temperature.
Table 3: Values of the soil temperature for zones, boxes, and ambient temperature.
| Zone 1 | Zone 2 | Zone 3 | Zone 4 | Zone 5 | Zone 6 | Zone 7 | Zone 8 | Box | Amb. | |
|---|---|---|---|---|---|---|---|---|---|---|
| Min | 18.2 | 20.1 | 22.2 | 22.4 | 21.6 | 21.9 | 19.4 | 23.2 | 16.3 | 18.4 |
| Aver. | 23.4 | 23.0 | 23.8 | 24.9 | 23.4 | 23.7 | 23.9 | 24.5 | 23.4 | 23.8 |
| Max. | 32.7 | 28.0 | 25.1 | 28.1 | 25.7 | 24.9 | 32.8 | 25.8 | 34.4 | 32.1 |
| Diff. | 14.5 | 7.9 | 2.9 | 5.7 | 4.1 | 3.0 | 13.4 | 2.6 | 18.1 | 13.7 |
In comparison, the soil temperatures of zones 3, 5, 6, and 8 vary only between 22 °C and 26 °C, which ensures stable conditions for the growth of plants, specifically with temperature differences of 2.9 °C, 3.0 °C, and 4.1 °C, respectively.
The inner temperature of the water valve box varied between 16.3 °C and 34.4 °C (ΔT = 18.1 °C), reflecting the operating conditions of the secondary module and the solenoid valve.
Fig. 13 shows the difference between the soil temperature and the ambient temperature. Zones 3, 5, 6, and 8 provide thermal isolation to the concrete roof; the soils are between 3 °C and 5 °C above the ambient temperature from 12 a.m. to 6 a.m. and achieve a temperature reduction of up to 9 °C during sun-hours.
Fig. 7 shows that the rainfall (9:14 p.m.) reduces the air temperature from approximately 23 °C to 19 °C in less than 3 min; nevertheless, the temperatures of zones 3, 5, 6, and 8 only fall below 1 °C after 15 min.
Fig. 13. Variation on soil temperature concerning ambient temperature.
3.4 Discussion
Water conservation is critical in agriculture; therefore, this smart irrigation system aims to minimize water use by applying drip irrigation and monitoring the soil moisture.Crop irrigation is relevant to crop productivity; therefore, it is necessary to ensure that the irrigation system is established based on the plant species and the favorable moisture level (Phasinam et al. 2022).
The irrigation time of each zone is affected by factors such as the consistency of the substrate and the separation between the drip lines. To reduce the irrigation time, central sprinklers are installed in zones 7 and 8.
This irrigation system uses sensors and the IoT, which allows interaction between a physical green roof and the Internet platform; in addition, the collected data help characterize the evolution of the soil and the plants.
An interface was developed that allows configuration of the operating parameters of the irrigation system, visualization of historical data, and obtaining the real-time behavior of the system operation using a web page. Additionally, the system issues a series of alerts that warn of a possible malfunction caused by a VWC value that exceeds the reasonable range or by an excess irrigation time.
Although some studies (Morillo et al. 2015; Nolz et al. 2016) have suggested that correct monitoring of the soil moisture level requires the installation of moisture sensors at different depths, this is infeasible for extensive green roofs, whose substrate thickness varies mostly between 10 and 20 cm.
During a follow-up study to determine the system operating limit values, it was found that it is impossible to generalize the locations of the moisture sensors. This is because their reading depends on factors such as the depth of the substrate and its consistency.
The above data obtained by the system allow inferring the health and effectiveness of a green roof for the growth of crops and the thermal isolation of buildings.
Although the system is designed based on the green roof conditions of the EEB, it can be implemented in greenhouses and orchards.
4. CONCLUSIONS
An irrigation system controlled and operated using low-cost devices was designed and implemented. The developed system allows, visualization of historical data as well as real-time behavior of the system operation, using a web platform. It also facilitates the configuration of the operating parameters.Monitoring the temporary variation in the VWC in the substrate of the zones allows adequate management of the irrigation system, thereby improving water use. It is also found that the VWC has a significant effect on the overall performance of the system, influencing its operation and the duration of irrigation in each zone. The VWC curves exhibit dynamic behavior, which is affected by various factors, including the soil heterogeneity and the crop characteristics. The above is directly related to the frequency of irrigation activation in the areas; the latter is also altered by climatic factors.
REFERENCES
Cook, Lauren M., and Tove A. Larsen. 2021. “Towards a Performance-Based Approach for Multifunctional Green Roofs : An Interdisciplinary Review.” Building and Environment 188(December 2020):107489.George, Daniel R., Liza S. Rovniak, Jennifer L. Kraschnewski, Ryan Hanson, and Christopher N. Sciamanna. 2015. “A Growing Opportunity: Community Gardens Affiliated with US Hospitals and Academic Health Centers.” Preventive Medicine Reports 2:35–39.
Halgamuge, Malka N., Alexe Bojovschi, Peter M. J. Fisher, Tu C. Le, Samuel Adeloju, and Susan Murphy. 2021. “Urban Forestry & Urban Greening Internet of Things and Autonomous Control for Vertical Cultivation Walls towards Smart Food Growing : A Review.” 61(March).
Jha, Kirtan, Aalap Doshi, Poojan Patel, and Manan Shah. 2019. “A Comprehensive Review on Automation in Agriculture Using Artificial Intelligence.” Artificial Intelligence in Agriculture 2:1–12.
Kamienski, Carlos, Juha Pekka Soininen, Markus Taumberger, Ramide Dantas, Attilio Toscano, Tullio Salmon Cinotti, Rodrigo Filev Maia, and André Torre Neto. 2019. “Smart Water Management Platform: IoT-Based Precision Irrigation for Agriculture.” Sensors (Switzerland) 19(2).
Kashyap, Pankaj Kumar, Sushil Kumar, Ankita Jaiswal, Mukesh Prasad, and Amir H. Gandomi. 2021. “Towards Precision Agriculture: IoT-Enabled Intelligent Irrigation Systems Using Deep Learning Neural Network.” IEEE Sensors Journal 21(16):17479–91.
Morillo, J. García, M. Martín, E. Camacho, J. A. Rodrígue. Díaz, and P. Montesinos. 2015. “Toward Precision Irrigation for Intensive Strawberry Cultivation.” Agricultural Water Management 151:43–51.
Muangprathub, Jirapond, Nathaphon Boonnam, Siriwan Kajornkasirat, Narongsak Lekbangpong, Apirat Wanichsombat, and Pichetwut Nillaor. 2019. “IoT and Agriculture Data Analysis for Smart Farm.” Computers and Electronics in Agriculture 156(June 2018):467–74.
Nolz, R., P. Cepuder, J. Balas, and W. Loiskandl. 2016. “Soil Water Monitoring in a Vineyard and Assessment of Unsaturated Hydraulic Parameters as Thresholds for Irrigation Management.” Agricultural Water Management 164:235–42.
Osma-Pinto, G., and G. Ordóñez-Plata. 2019. “Measuring Factors Influencing Performance of Rooftop PV Panels in Warm Tropical Climates.” Solar Energy 185.
Osma-Pinto, German, and Laura Amado-Duarte. 2021. “Selection of the Control Alternative with the Minimum Energy Consumption for the Hybrid Illumination System of Inner Spaces.” Journal of Building Engineering 35(April 2020):102046.
Paraskevopoulou, Angeliki T., Panagiotis Tsarouchas, Paraskevi A. Londra, and Athanasios P. Kamoutsis. 2020. “The Effect of Irrigation Treatment on the Growth of Lavender Species in an Extensive Green Roof System.” Water 12(863):1–18.
Phasinam, Khongdet, Thanwamas Kassanuk, Priyanka P. Shinde, Chetan M. Thakar, Dilip Kumar Sharma, Khaja Mohiddin, and Abdul Wahab Rahmani. 2022. “Application of IoT and Cloud Computing in Automation of Agriculture Irrigation.” Journal of Food Quality 2022:1–8.
Rawal, Srishti. 2017. “IOT Based Smart Irrigation System.” International Journal of Computer Applications 159(8):7–11.
Seidel, S. J., S. Werisch, N. Schütze, and H. Laber. 2017. “Impact of Irrigation on Plant Growth and Development of White Cabbage.” Agricultural Water Management 187:99–111.
Shaheen, Sk Safiya, S. Bhagya Priya, and S. Harsha. 2021. “Smart Irrigation System Based on IoT.” International Journal of Trend in Innovative Research (IJTIIR) 3(3):28–31.
Susca, Tiziana. 2019. “Green Roofs to Reduce Building Energy Use? A Review on Key Structural Factors of Green Roofs and Their Effects on Urban Climate.” Building and Environment 162.
Zluwa, Irene, and Ulrike Pitha. 2021. “The Combination of Building Greenery and Photovoltaic Energy Production — A Discussion of Challenges and Opportunities in Design.” Sustainability 13(1537):1–29.
Universidad de Pamplona
I. I. D. T. A.
I. I. D. T. A.