Revista Colombiana de
Tecnologías de Avanzada
Tecnologías de Avanzada
Recibido: 10 de abril de 2023
Aceptado: 15 de julio de 2023
Aceptado: 15 de julio de 2023
PREDICCIÓN DEL FENÓMENO DE LA PRECIPITACIÓN AMBIENTAL EN EL MUNICIPIO DE AQUITANIA
PREDICTION OF THE ENVIRONMENTAL PRECIPITATION PHENOMENON IN AQUITANIA
 Ing. Viviana M. Bernal-Benítez*, Ing. Juan C. Gómez-Malagón*, MSc. Camilo Pardo-Beainy*
* Universidad Santo Tomás, Electronic Engineering Faculty.
Av. Universitaria No. 45 – 202, Tunja, Boyacá Colombia.
Tel.: 57-8-7440404, Ext. 5612
E-mail: {viviana.bernal, juan.gomezm, camilo.pardo}@usantoto.edu.co
PREDICTION OF THE ENVIRONMENTAL PRECIPITATION PHENOMENON IN AQUITANIA
Ing. Viviana M. Bernal-Benítez*, Ing. Juan C. Gómez-Malagón*, MSc. Camilo Pardo-Beainy*
* Universidad Santo Tomás, Electronic Engineering Faculty.
Av. Universitaria No. 45 – 202, Tunja, Boyacá Colombia.
Tel.: 57-8-7440404, Ext. 5612
E-mail: {viviana.bernal, juan.gomezm, camilo.pardo}@usantoto.edu.co
Cómo citar: Bernal-Benítez, V. M., Gómez-Malagón, J. C., & Pardo-Beainy, C. (2023). PREDICCIÓN DEL FENÓMENO DE LA PRECIPITACIÓN AMBIENTAL EN EL MUNICIPIO DE AQUITANIA. REVISTA COLOMBIANA DE TECNOLOGIAS DE AVANZADA (RCTA), 2(42), 17–22. https://doi.org/10.24054/rcta.v2i42.2649
Derechos de autor 2023 Revista Colombiana de Tecnologías de Avanzada (RCTA).
Esta obra está bajo una licencia internacional Creative Commons Atribución-NoComercial 4.0.

Esta obra está bajo una licencia internacional Creative Commons Atribución-NoComercial 4.0.
Abstract: The science of meteorology generates important predictions about the phenomena, which occur in the atmosphere every day and have a great importance in human activities such as agriculture, the sustainability of ecosystems and climate analysis. This project seeks to create a predictive system for atmospheric precipitation, which works with Machine Learning techniques using data collected from climate monitoring over Aquitania, a town in Boyacá department. To generate this classifier algorithm, the resources of IBM Watson and the tool to create the code in Python: Jupyter Notebook. The algorithm is trained using a dataset, which contains 35 years of meteorological information taken from the settlement Hoya La Manzana. The process developed begins with the refinement and cleaning of the dataset, then, the creation of the training model with 80% of the dataset to proceed with the algorithm test using the remaining 20% and finishes with the analysis of the results obtained in the predictive system implementation relying on evaluation metrics such as precision, accuracy, sensitivity of the system, which allow identifying the variations in performance of each model. An accuracy of almost 96% was achieved with the algorithm based on Decision Trees, this being a possible starting point for the construction of a high-efficiency tool that allows farmers to increase the productivity of the land, anticipating possible climatic changes, which may affect their health and the development of their crops.
Palabras clave: Gradient Boost, Environmental Precipitation, Python, IBM Watson, Meteorology, Machine Learning.
Keywords: La ciencia de la meteorología genera importantes predicciones sobre los fenómenos que ocurren día a día en la atmósfera y que son de gran importancia para las actividades humanas como la agricultura, la sostenibilidad de los ecosistemas y el análisis climático. Con este Proyecto, se busca crear un sistema predictivo de precipitación atmosférica que trabaja con técnicas de Machine Learning haciendo uso de datos recolectados del monitoreo climático sobre el municipio de Aquitania en el departamento de Boyacá. Para generar este sistema predictivo de precipitación atmosférica, se utilizan los recursos de IBM Watson y la herramienta para la creación de código en Python: Jupyter Notebook. El algoritmo es entrenado empleando un conjunto de datos que contiene 35 años de información meteorológica tomados de la vereda Hoya La Manzana. El proceso desarrollado inicia con el refinamiento y limpieza del conjunto de datos, a continuación, la creación del modelo de entrenamiento con el 80% del dataset para proceder con la prueba del algoritmo empleando el 20% restante y finaliza con el análisis de los resultados obtenidos en la implementación del sistema predictivo apoyándose en métricas de evaluación tales como precisión, exactitud, sensibilidad del sistema, las cuales permiten observar las variaciones en el desempeño de cada uno de los modelos. Se consiguió una precisión de casi el 96% con el algoritmo fundamentado en Arboles de decisión, siendo este un posible punto de partida para la construcción de una herramienta de alta eficiencia que permita a los agricultores aumentar la productividad de la tierra, anticipándose a los posibles cambios climáticos que puedan afectar la salud y el desarrollo de sus cultivos.
Resumen: Aumento de Gradiente, Precipitación Ambiental, Python, IBM Watson, Meteorología, Aprendizaje automático.
Some references to the state of the art related to predictive systems for meteorological data analysis are presented below:
F. Riabani., W. García. y J. Herrera.
In China, G. Chen., S. Li. Y L. Knibbs.
H. Han., S. Lee. y M. Kim.
Equation (1)
\[ \text{obj}^{(t)} = \sum_{i=1}^n l(y_i, \hat{y}_i^{(t)}) \hspace{1cm} (1)\] In consideration of all the benefits of this classifier algorithm, it is implemented in Jupyter Notebook following the scikit-learn topology.
Using Matplotlib, some of these metrics can be visualized graphically. The ROC curve (Fig. 11) represents the relationship between sensitivity and false positive rate.
An accuracy of almost 96% was achieved with the algorithm based on Decision Trees. Being this, a possible starting point for the construction of a highly efficient tool that allows farmers to increase the productivity of the land, anticipating possible climate changes that may affect the health and work in their crops.
The gradient boosting classifier algorithm generates a decrease in false negatives, but an increase in false positives, as seen in Figure 12. The two models have close precision, but the gradient increase provides greater sensitivity.
Using Watson Studio's Machine Learning tool was a great advantage to identify an algorithm that best fits the characteristics of the dataset. In addition, it is an accessible and easy to use service, allowing field workers or local government entities, specifically Aquitania’s, to use it. This is a great step forward in the appropriation of technology in agricultural processes.
Finally, it should be clarified that, although it is a significant topic, it would take time to develop it on a large scale. This represents an invitation to do this type of research both continue and incorporate diverse information such as: what is more appropriate to sow depending on weather conditions, records of sowing, flowering and crop control and others.
Chen, G., Li, S., Knibbs, L. D., Hamm, N. A. S., Cao, W., Li, T., Guo, J., Ren, H., Abramson, M. J., & Guo, Y. (2018). A machine learning method to estimate PM2.5 concentrations across China with remote sensing, meteorological and land use information. Science of the Total Environment, 636, 52–60. https://doi.org/10.1016/j.scitotenv.2018.04.251
Colston, J. M., Ahmed, T., Mahopo, C., Kang, G., Kosek, M., Junior, F. de S., Shrestha, P. S., Svensen, E., Turab, A., Zaitchik, B., & Network, T. M.-E. (2018). Evaluating meteorological data from weather stations, and from satellites and global models for a multi-site epidemiological study. Environmental Research, 165, 91–109.
Friedman, J. H. (2001). A gradient boosting machine. IMS 1999 Reitz Lecture, №3, 39.
Gonçalves, A. M., Silva, J. G., & Gomes, P. M. V. (2006). Meteorological support to forest fire prevention. In Forest Ecology and Management (Vol. 234, p. S41). https://doi.org/10.1016/j.foreco.2006.08.062
Han, H., Lee, S., Im, J., Kim, M., Lee, M. I., Ahn, M. H., & Chung, S. R. (2015). Detection of convective initiation using Meteorological Imager onboard Communication, Ocean, and Meteorological Satellite based on machine learning approaches. Remote Sensing, 7(7), 9184–9204. https://doi.org/10.3390/rs70709184
IBM’s AutoAI at work: two real-world applications | by Álvaro Corrales Cano | IBM Garage | Medium. (n.d.).
Kok, M., Smith, J. G., Wohl, C. J., Siochi, E. J., & Young, T. M. (2015). Critical considerations in the mitigation of insect residue contamination on aircraft surfaces - A review. In Progress in Aerospace Sciences (Vol. 75, pp. 1–14). https://doi.org/10.1016/j.paerosci.2015.02.001
Lu, H., Wu, Y., Li, Y., & Liu, Y. (2017). Effects of meteorological droughts on agricultural water resources in southern China. In Journal of Hydrology (Vol. 548, pp. 419–435). https://doi.org/10.1016/j.jhydrol.2017.03.021
Ma, P., Wang, S., Zhou, J., Li, T., Fan, X., Fan, J., & Wang, S. (2020). Meteorological rhythms of respiratory and circulatory diseases revealed by Harmonic Analysis. In Heliyon (Vol. 6, Issue 5). https://doi.org/10.1016/j.heliyon.2020.e04034
Natekin, A., & Knoll, A. (2013). Gradient boosting machines, a tutorial. Frontiers in Neurorobotics, 7(DEC). https://doi.org/10.3389/fnbot.2013.00021
Riabani Mercado, F., García Fernández, W., & Herrera Acebey, J. A. (2016). Sistema de inteligencia artificial para la predicción temprana de heladas meteorológicas. Acta Nova, 7(4), 483–495.
Rozenstein, O., & Karnieli, A. (2011). Comparison of methods for land-use classification incorporating remote sensing and GIS inputs. In Applied Geography (Vol. 31, Issue 2, pp. 533–544). https://doi.org/10.1016/j.apgeog.2010.11.006
Sotelo, S., Guevara, E., Llanos-Herrera, L., Agudelo, D., Esquivel, A., Rodriguez, J., Ordoñez, L., Mesa, J., Muñoz Borja, L. A., Howland, F., Amariles, S., Rojas, A., Valencia, J. J., Segura, C. C., Grajales, F., Hernández, F., Cote, F., Saavedra, E., Ruiz, F., … Ramirez-Villegas, J. (2020). Pronosticos AClimateColombia: A system for the provision of information for climate risk reduction in Colombia. Computers and Electronics in Agriculture, 174. https://doi.org/10.1016/j.compag.2020.105486
Wardah, T., Abu Bakar, S. H., Bardossy, A., & Maznorizan, M. (2008). Use of geostationary meteorological satellite images in convective rain estimation for flash-flood forecasting. Journal of Hydrology, 356(3–4), 283–298. https://doi.org/10.1016/j.jhydrol.2008.04.015
Palabras clave: Gradient Boost, Environmental Precipitation, Python, IBM Watson, Meteorology, Machine Learning.
Keywords: La ciencia de la meteorología genera importantes predicciones sobre los fenómenos que ocurren día a día en la atmósfera y que son de gran importancia para las actividades humanas como la agricultura, la sostenibilidad de los ecosistemas y el análisis climático. Con este Proyecto, se busca crear un sistema predictivo de precipitación atmosférica que trabaja con técnicas de Machine Learning haciendo uso de datos recolectados del monitoreo climático sobre el municipio de Aquitania en el departamento de Boyacá. Para generar este sistema predictivo de precipitación atmosférica, se utilizan los recursos de IBM Watson y la herramienta para la creación de código en Python: Jupyter Notebook. El algoritmo es entrenado empleando un conjunto de datos que contiene 35 años de información meteorológica tomados de la vereda Hoya La Manzana. El proceso desarrollado inicia con el refinamiento y limpieza del conjunto de datos, a continuación, la creación del modelo de entrenamiento con el 80% del dataset para proceder con la prueba del algoritmo empleando el 20% restante y finaliza con el análisis de los resultados obtenidos en la implementación del sistema predictivo apoyándose en métricas de evaluación tales como precisión, exactitud, sensibilidad del sistema, las cuales permiten observar las variaciones en el desempeño de cada uno de los modelos. Se consiguió una precisión de casi el 96% con el algoritmo fundamentado en Arboles de decisión, siendo este un posible punto de partida para la construcción de una herramienta de alta eficiencia que permita a los agricultores aumentar la productividad de la tierra, anticipándose a los posibles cambios climáticos que puedan afectar la salud y el desarrollo de sus cultivos.
Resumen: Aumento de Gradiente, Precipitación Ambiental, Python, IBM Watson, Meteorología, Aprendizaje automático.
1. INTRODUCTION
Meteorology is a discipline that studies and predicts the different phenomena that occur in the atmosphere(Wardah et al., 2008)
, and provides important daily predictions that are useful for different human activities such as: agriculture Wardah, T., Abu Bakar, S. H., Bardossy, A., & Maznorizan, M. (2008). Use of geostationary meteorological satellite images in convective rain estimation for flash-flood forecasting. Journal of Hydrology, 356(3–4), 283–298. https://doi.org/10.1016/j.jhydrol.2008.04.015
(Lu et al., 2017)
, aeronautics Lu, H., Wu, Y., Li, Y., & Liu, Y. (2017). Effects of meteorological droughts on agricultural water resources in southern China. In Journal of Hydrology (Vol. 548, pp. 419–435). https://doi.org/10.1016/j.jhydrol.2017.03.021
(Kok et al., 2015)
, navigation Kok, M., Smith, J. G., Wohl, C. J., Siochi, E. J., & Young, T. M. (2015). Critical considerations in the mitigation of insect residue contamination on aircraft surfaces - A review. In Progress in Aerospace Sciences (Vol. 75, pp. 1–14). https://doi.org/10.1016/j.paerosci.2015.02.001
(Bosy et al., 2010)
, military activities Bosy, J., Rohm, W., Borkowski, A., Kroszczynski, K., & Figurski, M. (2010). Integration and verification of meteorological observations and NWP model data for the local GNSS tomography. Atmospheric Research, 96(4), 522–530. https://doi.org/10.1016/j.atmosres.2009.12.012
(Rozenstein & Karnieli, 2011)
, disease prediction Rozenstein, O., & Karnieli, A. (2011). Comparison of methods for land-use classification incorporating remote sensing and GIS inputs. In Applied Geography (Vol. 31, Issue 2, pp. 533–544). https://doi.org/10.1016/j.apgeog.2010.11.006
(Ma et al., 2020)
and fire prevention Ma, P., Wang, S., Zhou, J., Li, T., Fan, X., Fan, J., & Wang, S. (2020). Meteorological rhythms of respiratory and circulatory diseases revealed by Harmonic Analysis. In Heliyon (Vol. 6, Issue 5). https://doi.org/10.1016/j.heliyon.2020.e04034
(Gonçalves et al., 2006)
. Weather stations are made up of instruments that measure, record and share information about various factors such as: temperature, humidity, atmospheric pressure, etc., and, then, make records and share them with other stations Gonçalves, A. M., Silva, J. G., & Gomes, P. M. V. (2006). Meteorological support to forest fire prevention. In Forest Ecology and Management (Vol. 234, p. S41). https://doi.org/10.1016/j.foreco.2006.08.062
(Colston et al., 2018)
. In order to generate accurate atmospheric forecasts, it is important to have a considerable number of stations distributed throughout the territory. When the IDEAM database is queried Colston, J. M., Ahmed, T., Mahopo, C., Kang, G., Kosek, M., Junior, F. de S., Shrestha, P. S., Svensen, E., Turab, A., Zaitchik, B., & Network, T. M.-E. (2018). Evaluating meteorological data from weather stations, and from satellites and global models for a multi-site epidemiological study. Environmental Research, 165, 91–109.
(Sotelo et al., 2020)
, it is evident that in the Boyacá department many stations are not in operation or do not provide 100% of the information necessary to create a model to alert populations prone to environmental catastrophes. For this reason, this research is oriented towards the design of a prediction algorithm that allows to know if it will rain or not, using a dataset containing 35 years of meteorological information about solar radiation, temperature and relative humidity over the settlement La Hoya in Aquitania, Boyacá.Sotelo, S., Guevara, E., Llanos-Herrera, L., Agudelo, D., Esquivel, A., Rodriguez, J., Ordoñez, L., Mesa, J., Muñoz Borja, L. A., Howland, F., Amariles, S., Rojas, A., Valencia, J. J., Segura, C. C., Grajales, F., Hernández, F., Cote, F., Saavedra, E., Ruiz, F., … Ramirez-Villegas, J. (2020). Pronosticos AClimateColombia: A system for the provision of information for climate risk reduction in Colombia. Computers and Electronics in Agriculture, 174. https://doi.org/10.1016/j.compag.2020.105486
Some references to the state of the art related to predictive systems for meteorological data analysis are presented below:
F. Riabani., W. García. y J. Herrera.
(Riabani Mercado et al., 2016)
implemented a neural network trained with the algorithm proposed by Huang in order to predict meteorological frosts in the Cochabamba department in Bolivia.Riabani Mercado, F., García Fernández, W., & Herrera Acebey, J. A. (2016). Sistema de inteligencia artificial para la predicción temprana de heladas meteorológicas. Acta Nova, 7(4), 483–495.
In China, G. Chen., S. Li. Y L. Knibbs.
(Chen et al., 2018)
, using aerosol optical thickness data, meteorology and other predictors, developed a random forest model and two traditional regression models to estimate ground-level PM2.5 concentrations.Chen, G., Li, S., Knibbs, L. D., Hamm, N. A. S., Cao, W., Li, T., Guo, J., Ren, H., Abramson, M. J., & Guo, Y. (2018). A machine learning method to estimate PM2.5 concentrations across China with remote sensing, meteorological and land use information. Science of the Total Environment, 636, 52–60. https://doi.org/10.1016/j.scitotenv.2018.04.251
H. Han., S. Lee. y M. Kim.
(Han et al., 2015)
created an official algorithm for the detection of convective cloud initiation over Northeast Asia, using information from the weather imager and COMS1 satellite data. They relied on three machine learning approaches: decision trees, random forests and support vector machines in order to mitigate the damage caused by convective initiation hazards.Han, H., Lee, S., Im, J., Kim, M., Lee, M. I., Ahn, M. H., & Chung, S. R. (2015). Detection of convective initiation using Meteorological Imager onboard Communication, Ocean, and Meteorological Satellite based on machine learning approaches. Remote Sensing, 7(7), 9184–9204. https://doi.org/10.3390/rs70709184
2. MATERIALS AND METHODS
IBM Watson resources and Python coding are used to create the classifier algorithm in order to compare the performance of these two services.2.1. Classifier Algorithm Using IBM Watson
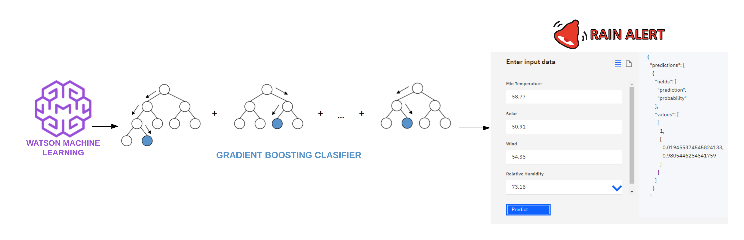
IBM Watson is an Artificial Intelligence platform with a collection of services and skills that includes Machine Learning. Figure 1 presents the general implementation scheme; for the study case, a Gradient Augmentation classifier algorithm was used on the generated application called Rain Alert.
Fig. 1. General scheme, implementation of the algorithm with IBM Watson
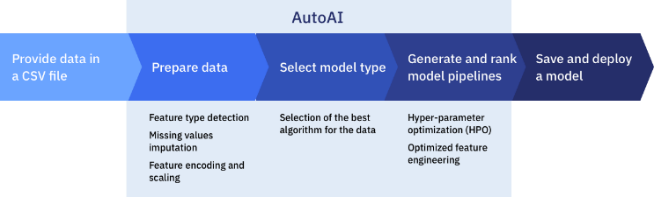
Initially, with the IBM Watson Studio service, the original dataset is refined and all data is normalized. It allows the attributes to have the same weight when the algorithm is created. Then, using the AutoAI service, the learning model is built and implemented. It automatically performs the selection of models that best fit the data. The user of this service must provide a dataset in .csv format and indicate the attribute to be predicted and, then, deploy the selected model. Optionally, the user can intervene in the AutoAI process during the selection of: the optimization metric, the algorithms to be executed, the amount of data assigned for training and testing, as well as, the value associated with the positive result. After applying the above modifications, the training model is created and the construction model is displayed for each pipeline as shown in Figure 2.
Fig. 2. AutoAI process. (IBM’s AutoAI at Work: Two Real-World Applications | by Álvaro Corrales Cano | IBM Garage | Medium, n.d.)
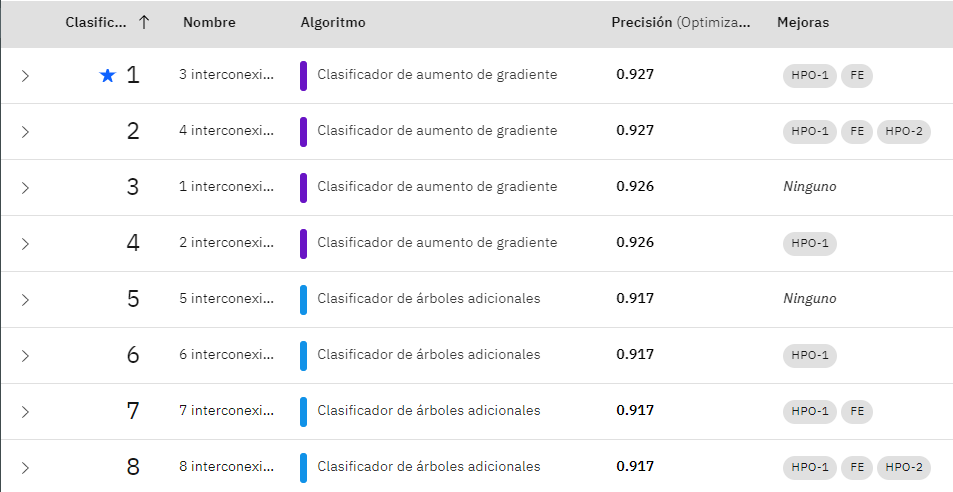
At the end of this step, a table is created (Fig. 3) in which each process chain is classified depending on the accuracy of the evaluation metric. As can be seen, the algorithm that best fits the dataset is the gradient boosting classifier.
Fig. 3. Classification of generated pipelines
This gradient boosting classifier algorithm is used for classification and regression. It is based on the combination of weak predictive models that are usually Decision Trees in order to create a strong predictive model. The generation of weak decision trees is performed sequentially, each tree being created in such a way that fixes the errors of the previous tree (Natekin & Knoll, 2013)
. One of the parameters of this type of arguments is the learning rate that controls the degree of tree improvement with respect to the previous one.Natekin, A., & Knoll, A. (2013). Gradient boosting machines, a tutorial. Frontiers in Neurorobotics, 7(DEC). https://doi.org/10.3389/fnbot.2013.00021
Equation (1)
(Friedman, 2001)
is the mathematical expression of this algorithm, where \(\hat{y}\) is the prediction to be optimized. For this purpose, an objective function is created based on the quadratic error which must be minimized.Friedman, J. H. (2001). A gradient boosting machine. IMS 1999 Reitz Lecture, №3, 39.
\[ \text{obj}^{(t)} = \sum_{i=1}^n l(y_i, \hat{y}_i^{(t)}) \hspace{1cm} (1)\] In consideration of all the benefits of this classifier algorithm, it is implemented in Jupyter Notebook following the scikit-learn topology.
2.2 Classifier Algorithm in Python
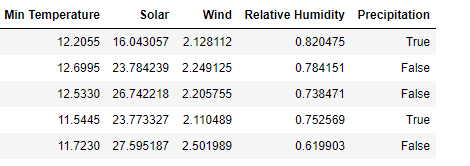
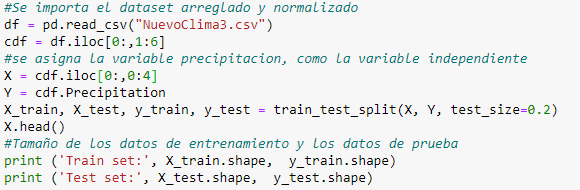
In Jupyter Notebook scripts, the gradient increase classifier algorithm is replicated and the simple decision tree algorithm is also implemented in order to make a comparison between them using the different evaluation metrics. For this dataset, a previous data cleaning and organization is performed, eliminating some variables such as date, latitude and longitude. With the variables of maximum and minimum temperatures for each day an average value is calculated, which is stored in the variable 'Min Termperature' and the variable 'Precipitation' is also defined as the parameter to be classified. Figure 4 shows a section of the modified dataset.
Fig. 4. Header of modified dataset
With this information it is possible to separate the independent variables (Min Temperature, Solar, Wind, Relative Humidity) from the dependent variable (Precipitation). In addition, 80% of the dataset is defined for algorithm training and 20% for algorithm testing. The process of this data splitting is illustrated in Figure 5.
Fig. 5. Data split
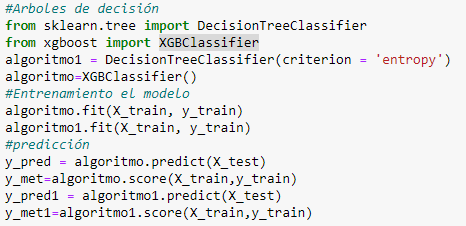
Using the different tools of the scikit-learn library, the 'DecisionTreeClassifier' and 'XGBClassifier' functions are called to train the models and the "predict" command is used to test them (Fig. 6).
Fig. 6. Algorithm training and testing
3. RESULTS
3.1 Classifier Algorithm using IBM Watson
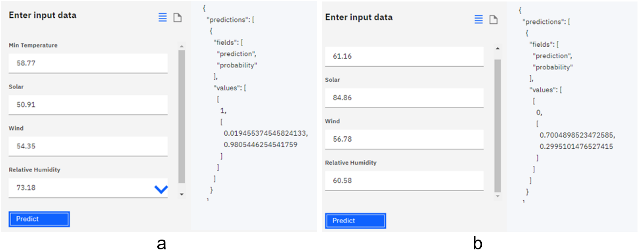
After selecting the algorithm that best fit the requirements, it is deployed and tested, as shown in figure 7a. On the left, the information corresponding to the independent variables is entered and, when pressing on the prediction box, the classification algorithm is applied and the result on the right is obtained. In the case of figure 7a, a positive response is obtained (Values=1), which indicates that with these parameters there is a 98% probability of rainfall. In contrast to the result obtained in figure 7b, where there is a 70% probability of no rain.
Fig. 7. Precipitation predictor system (a) Positive result (b) Negative result.
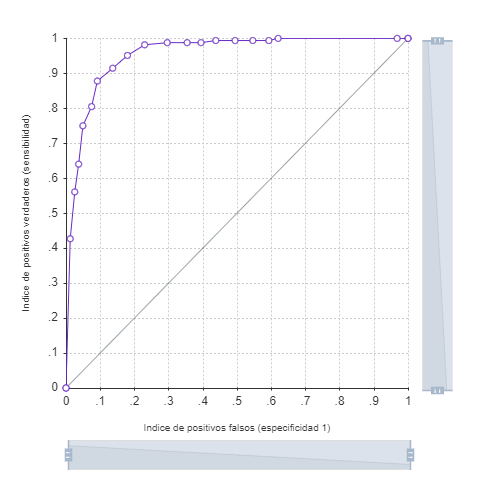
As can be seen, in the ROC curve graph (Fig. 8), the ratio of the proportion of correctly predicted positive results versus the proportion of negative results falsely predicted as positive, indicates a high level of model performance and is corroborated by the value of the area under the curve, which refers to 95.7% of correct predictions.
Fig. 8. ROC curve
In addition, some algorithm evaluation metrics were determined to corroborate the performance (Table 1).Table 1: Algorithm evaluation metrics.
| Evaluation metric | Score |
|---|---|
| Precision | 0.927 |
| Recall | 0.970 |
| ROC AUC | 0.957 |
| F1 | 0.959 |
3.2 Classifier Algorithm in Python
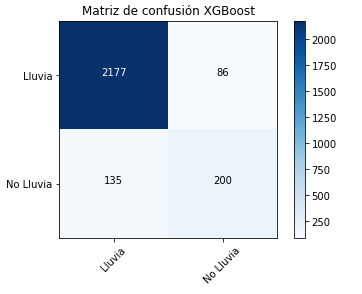
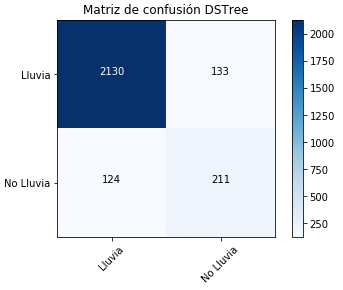
The confusion matrix was generated for each algorithm, which allows us to compare the amount of data that were correctly classified and also to observe the variations of each of the evaluation metrics of the models. Figures 9 and 10 present the confusion matrices of the XG Boost and Decision Tree algorithms.
Fig. 9. Confusion Matrix for XG Boost
Fig. 10. Confusion Matrix for Decision Tree.
For the classifier algorithm developed using Python, the evaluation metrics for each model were calculated using the 'sklearn.metrics' library, from which the results presented in Table 2 were obtained.Table 2: Algorithm evaluation metrics
| Evaluation metric | XG Boost | DS Tree |
|---|---|---|
| Precision | 0.941609 | 0.944987 |
| Accuracy | 0.914935 | 0.901078 |
| Sensitivity | 0.961997 | 0.941228 |
| F1 Score | 0.951694 | 0.943104 |
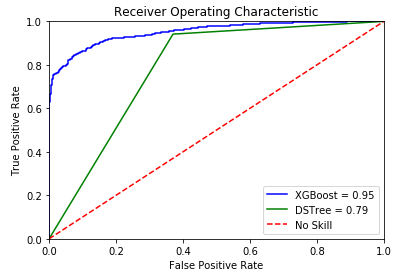
Using Matplotlib, some of these metrics can be visualized graphically. The ROC curve (Fig. 11) represents the relationship between sensitivity and false positive rate.
Fig. 11. ROC curve.
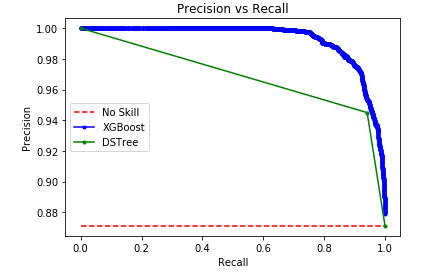
Fig. 12. PR curve.
The graph of the relationship between accuracy and sensitivity of the models was also made (Fig. 12). It can be said that these two metrics are inversely proportional, if the model is very sensitive and predicts a lot of data as rain, the error will increase. However, if the accuracy is increased close to 100%, the model will increase the amount of False Negatives, which in turn would decrease the recall. This graph porpuse is that it is as close as possible to the upper right corner where both variables have their maximum value.4. CONCLUSIONS
In both algorithms the data imbalance is evident; so, the ROC curve is not very useful. In this case, the PR curve provides more assertive information about the accuracy of the model. For the XG Boost classifier, a higher accuracy and a smoother curve than the simple decision tree is obtained. It is due to the variability in the percentage of probability that a predicted data is 1 or 0, which in the case of the decision tree is a constant (0.94).An accuracy of almost 96% was achieved with the algorithm based on Decision Trees. Being this, a possible starting point for the construction of a highly efficient tool that allows farmers to increase the productivity of the land, anticipating possible climate changes that may affect the health and work in their crops.
The gradient boosting classifier algorithm generates a decrease in false negatives, but an increase in false positives, as seen in Figure 12. The two models have close precision, but the gradient increase provides greater sensitivity.
Using Watson Studio's Machine Learning tool was a great advantage to identify an algorithm that best fits the characteristics of the dataset. In addition, it is an accessible and easy to use service, allowing field workers or local government entities, specifically Aquitania’s, to use it. This is a great step forward in the appropriation of technology in agricultural processes.
Finally, it should be clarified that, although it is a significant topic, it would take time to develop it on a large scale. This represents an invitation to do this type of research both continue and incorporate diverse information such as: what is more appropriate to sow depending on weather conditions, records of sowing, flowering and crop control and others.
REFERENCES
Bosy, J., Rohm, W., Borkowski, A., Kroszczynski, K., & Figurski, M. (2010). Integration and verification of meteorological observations and NWP model data for the local GNSS tomography. Atmospheric Research, 96(4), 522–530. https://doi.org/10.1016/j.atmosres.2009.12.012Chen, G., Li, S., Knibbs, L. D., Hamm, N. A. S., Cao, W., Li, T., Guo, J., Ren, H., Abramson, M. J., & Guo, Y. (2018). A machine learning method to estimate PM2.5 concentrations across China with remote sensing, meteorological and land use information. Science of the Total Environment, 636, 52–60. https://doi.org/10.1016/j.scitotenv.2018.04.251
Colston, J. M., Ahmed, T., Mahopo, C., Kang, G., Kosek, M., Junior, F. de S., Shrestha, P. S., Svensen, E., Turab, A., Zaitchik, B., & Network, T. M.-E. (2018). Evaluating meteorological data from weather stations, and from satellites and global models for a multi-site epidemiological study. Environmental Research, 165, 91–109.
Friedman, J. H. (2001). A gradient boosting machine. IMS 1999 Reitz Lecture, №3, 39.
Gonçalves, A. M., Silva, J. G., & Gomes, P. M. V. (2006). Meteorological support to forest fire prevention. In Forest Ecology and Management (Vol. 234, p. S41). https://doi.org/10.1016/j.foreco.2006.08.062
Han, H., Lee, S., Im, J., Kim, M., Lee, M. I., Ahn, M. H., & Chung, S. R. (2015). Detection of convective initiation using Meteorological Imager onboard Communication, Ocean, and Meteorological Satellite based on machine learning approaches. Remote Sensing, 7(7), 9184–9204. https://doi.org/10.3390/rs70709184
IBM’s AutoAI at work: two real-world applications | by Álvaro Corrales Cano | IBM Garage | Medium. (n.d.).
Kok, M., Smith, J. G., Wohl, C. J., Siochi, E. J., & Young, T. M. (2015). Critical considerations in the mitigation of insect residue contamination on aircraft surfaces - A review. In Progress in Aerospace Sciences (Vol. 75, pp. 1–14). https://doi.org/10.1016/j.paerosci.2015.02.001
Lu, H., Wu, Y., Li, Y., & Liu, Y. (2017). Effects of meteorological droughts on agricultural water resources in southern China. In Journal of Hydrology (Vol. 548, pp. 419–435). https://doi.org/10.1016/j.jhydrol.2017.03.021
Ma, P., Wang, S., Zhou, J., Li, T., Fan, X., Fan, J., & Wang, S. (2020). Meteorological rhythms of respiratory and circulatory diseases revealed by Harmonic Analysis. In Heliyon (Vol. 6, Issue 5). https://doi.org/10.1016/j.heliyon.2020.e04034
Natekin, A., & Knoll, A. (2013). Gradient boosting machines, a tutorial. Frontiers in Neurorobotics, 7(DEC). https://doi.org/10.3389/fnbot.2013.00021
Riabani Mercado, F., García Fernández, W., & Herrera Acebey, J. A. (2016). Sistema de inteligencia artificial para la predicción temprana de heladas meteorológicas. Acta Nova, 7(4), 483–495.
Rozenstein, O., & Karnieli, A. (2011). Comparison of methods for land-use classification incorporating remote sensing and GIS inputs. In Applied Geography (Vol. 31, Issue 2, pp. 533–544). https://doi.org/10.1016/j.apgeog.2010.11.006
Sotelo, S., Guevara, E., Llanos-Herrera, L., Agudelo, D., Esquivel, A., Rodriguez, J., Ordoñez, L., Mesa, J., Muñoz Borja, L. A., Howland, F., Amariles, S., Rojas, A., Valencia, J. J., Segura, C. C., Grajales, F., Hernández, F., Cote, F., Saavedra, E., Ruiz, F., … Ramirez-Villegas, J. (2020). Pronosticos AClimateColombia: A system for the provision of information for climate risk reduction in Colombia. Computers and Electronics in Agriculture, 174. https://doi.org/10.1016/j.compag.2020.105486
Wardah, T., Abu Bakar, S. H., Bardossy, A., & Maznorizan, M. (2008). Use of geostationary meteorological satellite images in convective rain estimation for flash-flood forecasting. Journal of Hydrology, 356(3–4), 283–298. https://doi.org/10.1016/j.jhydrol.2008.04.015
Universidad de Pamplona
I. I. D. T. A.
I. I. D. T. A.