Revista Colombiana de
Tecnologías de Avanzada
Tecnologías de Avanzada
Recibido: 17 de noviembre de 2023
Aceptado: 16 de diciembre de 2023
Aceptado: 16 de diciembre de 2023
DEEP NEURAL NETWORKS FOR SENSITIVITY ASSESSMENT OF DESIGN VARIABLES ON THE STRUCTURAL DESIGN PARAMETERS OF FLEXIBLE PAVEMENTS FOR LOW-TRAFFIC VOLUME ROADS
REDES NEURONALES PROFUNDAS PARA LA EVALUACIÓN DE SENSIBILIDAD DE VARIABLES DE DISEÑO EN LOS PARÁMETROS DE DISEÑO ESTRUCTURAL DE PAVIMENTOS FLEXIBLES PARA VÍAS DE BAJO TRÁNSITO
 MSc. (c). Brayan A. Velasquez-Bueno*,
Ing. María J. Páez Arenas*,
PhD. Allex E. Alvarez*,
PhD. Vladimir E. Merchan*,
PhD. Carlos A. Fajardo**,
PhD. Gustavo Chio Cho*
MSc. (c). Brayan A. Velasquez-Bueno*,
Ing. María J. Páez Arenas*,
PhD. Allex E. Alvarez*,
PhD. Vladimir E. Merchan*,
PhD. Carlos A. Fajardo**,
PhD. Gustavo Chio Cho*
* Universidad Industrial de Santander, Facultad de Ingenierías Fisicomecánicas, Escuela de Ingeniería Civil.
Carrera 27 calle 9, Bucaramanga, Santander, Colombia.
(60 +7) 6344000 ext. 2332.
E-mail: {brayan.velasquez, maria2175566, allex.alvarez, vmerchan, gchioch}@uis.edu.co
** Universidad Industrial de Santander, Facultad de Ingenierías Fisicomecánicas, Escuela de Ingeniería Eléctrica, Electrónica, y de Telecomunicaciones.
Carrera 27 calle 9, Bucaramanga, Santander, Colombia.
(60 +7) 6344000 ext. 2485.
E-mail: cafajar@uis.edu.co
REDES NEURONALES PROFUNDAS PARA LA EVALUACIÓN DE SENSIBILIDAD DE VARIABLES DE DISEÑO EN LOS PARÁMETROS DE DISEÑO ESTRUCTURAL DE PAVIMENTOS FLEXIBLES PARA VÍAS DE BAJO TRÁNSITO
MSc. (c). Brayan A. Velasquez-Bueno*,
Ing. María J. Páez Arenas*,
PhD. Allex E. Alvarez*,
PhD. Vladimir E. Merchan*,
PhD. Carlos A. Fajardo**,
PhD. Gustavo Chio Cho*
* Universidad Industrial de Santander, Facultad de Ingenierías Fisicomecánicas, Escuela de Ingeniería Civil.
Carrera 27 calle 9, Bucaramanga, Santander, Colombia.
(60 +7) 6344000 ext. 2332.
E-mail: {brayan.velasquez, maria2175566, allex.alvarez, vmerchan, gchioch}@uis.edu.co
** Universidad Industrial de Santander, Facultad de Ingenierías Fisicomecánicas, Escuela de Ingeniería Eléctrica, Electrónica, y de Telecomunicaciones.
Carrera 27 calle 9, Bucaramanga, Santander, Colombia.
(60 +7) 6344000 ext. 2485.
E-mail: cafajar@uis.edu.co
Cómo citar: Velasquez, B., Páez Arenas, M. J., Alvarez Lugo, A. E., Merchan Jaimes, V. E., Fajardo Ariza, C. A., & Chio Cho, G. (2023). REDES NEURONALES PROFUNDAS PARA LA EVALUACIÓN DE SENSIBILIDAD DE VARIABLES DE DISEÑO EN LOS PARÁMETROS DE DISEÑO ESTRUCTURAL DE PAVIMENTOS FLEXIBLES PARA VÍAS DE BAJO TRÁNSITO. REVISTA COLOMBIANA DE TECNOLOGIAS DE AVANZADA (RCTA), 2(42), 122–130. Recuperado de https://ojs.unipamplona.edu.co/index.php/rcta/article/view/2597
Derechos de autor 2023 Revista Colombiana de Tecnologías de Avanzada (RCTA).
Esta obra está bajo una licencia internacional Creative Commons Atribución-NoComercial 4.0.

Esta obra está bajo una licencia internacional Creative Commons Atribución-NoComercial 4.0.
Abstract: This study aims to implement deep neural networks (DNNs) to assess the sensitivity level of design parameters in flexible pavements for roads with low traffic volume. One hundred eight structures were modeled using the Pitra Pave® software (i.e., multilayer elastic theory (MET) model for pavement structural analysis) to generate a database to develop the DNN models. The DNN models, through connection weights, allowed the comparison with MET to evaluate the sensitivity of the selected design variables (resilient modulus and layer thickness) on the structural design parameters. The results suggest the significant impact of layer thicknesses. In addition, the predictions of structural design parameters from these initial DNN models showed variations ranging from 0,03% to 10,87% compared to MET. Expanding the database and developing a multi-predictive network is recommended for future research.
Keywords: Deep neural network, sensitivity analysis, multilayer elastic theory, flexible pavements.
Resumen: El objetivo de este estudio es implementar redes neuronales profundas (RNPs) para evaluar la sensibilidad de parámetros de diseño en pavimentos flexibles de carreteras con bajo volumen de tráfico. Ciento ocho estructuras fueron modeladas utilizando el programa Pitra Pave® (modelo de teoría elástica multicapa (TEM) para análisis estructural de pavimentos) para generar la base de datos requerida para desarrollar las RNPs. Estas redes, a través de pesos de conexión, permitieron la comparación con TEM para evaluar la sensibilidad de las variables de diseño (módulo resiliente y espesor de capa) sobre los parámetros de diseño estructural. Los resultados sugieren el impacto significativo de los espesores de capa. Adicionalmente, las predicciones de los parámetros de diseño estructural obtenidos mediante las RNPs variaron entre 0,03% y 10,87% respecto a TEM. Para futuras investigaciones, se sugiere ampliar la base de datos y desarrollar una red multi-predictiva.
Palabras clave: Red neuronal profunda, análisis de sensibilidad, teoría elástica multicapa, pavimentos flexibles.
Theories for flexible pavement structural design currently include several approaches, from empirical to mechanistic (or rational) methods considering materials' visco elastoplastic non-linear behavior (Pereira & Pais, 2017). In addition, mechanistic methods based on multilayered elastic theory (MET) quantify the pavement structural response in terms of deformations and stresses on the principle that each material exhibits linear elastic behavior.
Furthermore, traditional mechanistic methods for flexible pavement design rely on controlling two response parameters: the horizontal tensile strain at the bottom of the asphalt concrete and vertical compression strain at the subgrade surface (Coria Gutiérrez et al., 2018), which are, respectively, associated with bottom-up fatigue cracking in the asphalt concrete and subgrade rutting (i.e., plastic deformation). The structural response of flexible pavements can also be evaluated based on another widely studied design criterion: surface deflection (Massenlli & Paiva, 2019).
Computational programs have supported mechanistic design approaches since the 1960s. These software include Bisar®, Kenpave®, Elsym5®, Pitra Pave®, and EVERSTRESS, among others. Furthermore, over the years, the software has been developed to model pavement structures using the finite element method, which enables the solution of constitutive equations for assessing stresses and strains (Rondón Quintana & Reyes Lizcano, 2007).
On the other hand, with the evolution of computational systems, artificial intelligence has become one of the main drivers in transforming research approaches across various fields of knowledge. In civil engineering, significant enhancements in accuracy, efficiency, and cost-effectiveness have been reported at different stages of projects. Specifically, in pavement engineering, various approaches have been considered, ranging from machine learning to deep learning (Gopalakrishnan, 2018); the latter includes neural networks that offer robust prediction tools and streamline various processes (Yang et al., 2021).
This study seeks to assess the level of sensitivity of design variables on the structural design parameters of flexible pavements for LVTR based on a deep neural network (DNN) for each structural design parameter. The predictor DNN models were constructed using synthetically generated data from the Pitra Pave® software (Loría-Salazar et al., 2017), which models flexible pavement structures based on the multilayer elastic theory (MET). The variables assessed in this study correspond to the primary structural design parameters evaluated in mechanistic design methods (Corté & Goux, 1996). These are horizontal tensile strain at the bottom of the asphalt concrete layer (\(\varepsilon_r\)), vertical compressive strain at the surface of the subgrade (\(\varepsilon_z\)), and surface deflection (\(\Delta_z\)). However, besides assessing the structural design parameters, the MET model allowed computing the deflection (vertical deformation), vertical strain, and horizontal strain at different depths. These data permitted additional refinement for the development of the DNN models.
These DNN models allowed for assessing the significance of the design variables (resilient modulus and layer thickness of each structural layer), determined by the connection weights between neurons, acquired during the learning process. Ultimately, these connection weights were compared with an assessment of the sensitivity level conducted using data from 108 simulations (16200 data) using the MET model (i.e., Pitra Pave® software), enabling the determination of the influence of design variables on typical pavement structural design parameters. The DNN models can help to determine structural design parameters for multiple pavement structures for LVTR in analysis conducted at the road network level. The options for these structures are constrained by the ranges established for the design variables evaluated.
The architectures of each proposed DNN were developed using a subset of the database obtained from modeling pavement structures with Pitra Pave®. The synthetic database was randomly divided into three subsets necessary for developing each DNN (Table 3). The architecture of each DNN model was trained using the adaptive moment estimation––Adam––optimizer (Kingma & Ba, 2014) with default parameters, except for the learning rate, which was varied and decreased by a factor of 0,8 when performance stabilized. The early stopping regularization technique was implemented to prevent overfitting by monitoring the loss on the validation test, and a 5-fold stratified approach was used to evaluate the model's performance and generalization capability.
For hyperparameter tuning, this study explored various combinations of the number of hidden layers, the number of neurons, and the activation functions. The selected architectures achieved the highest performance on the test set. The metrics used to evaluate the DNN models were the coefficient of determination (R2) and the root mean square error (RMSE). Fig. 3 presents the general scheme of the DNN architectures used, and Table 4 summarizes the number of neurons selected in the architectures of each DNN model. All hidden layers in the three DNN models used the rectified linear units—ReLU—activation function.
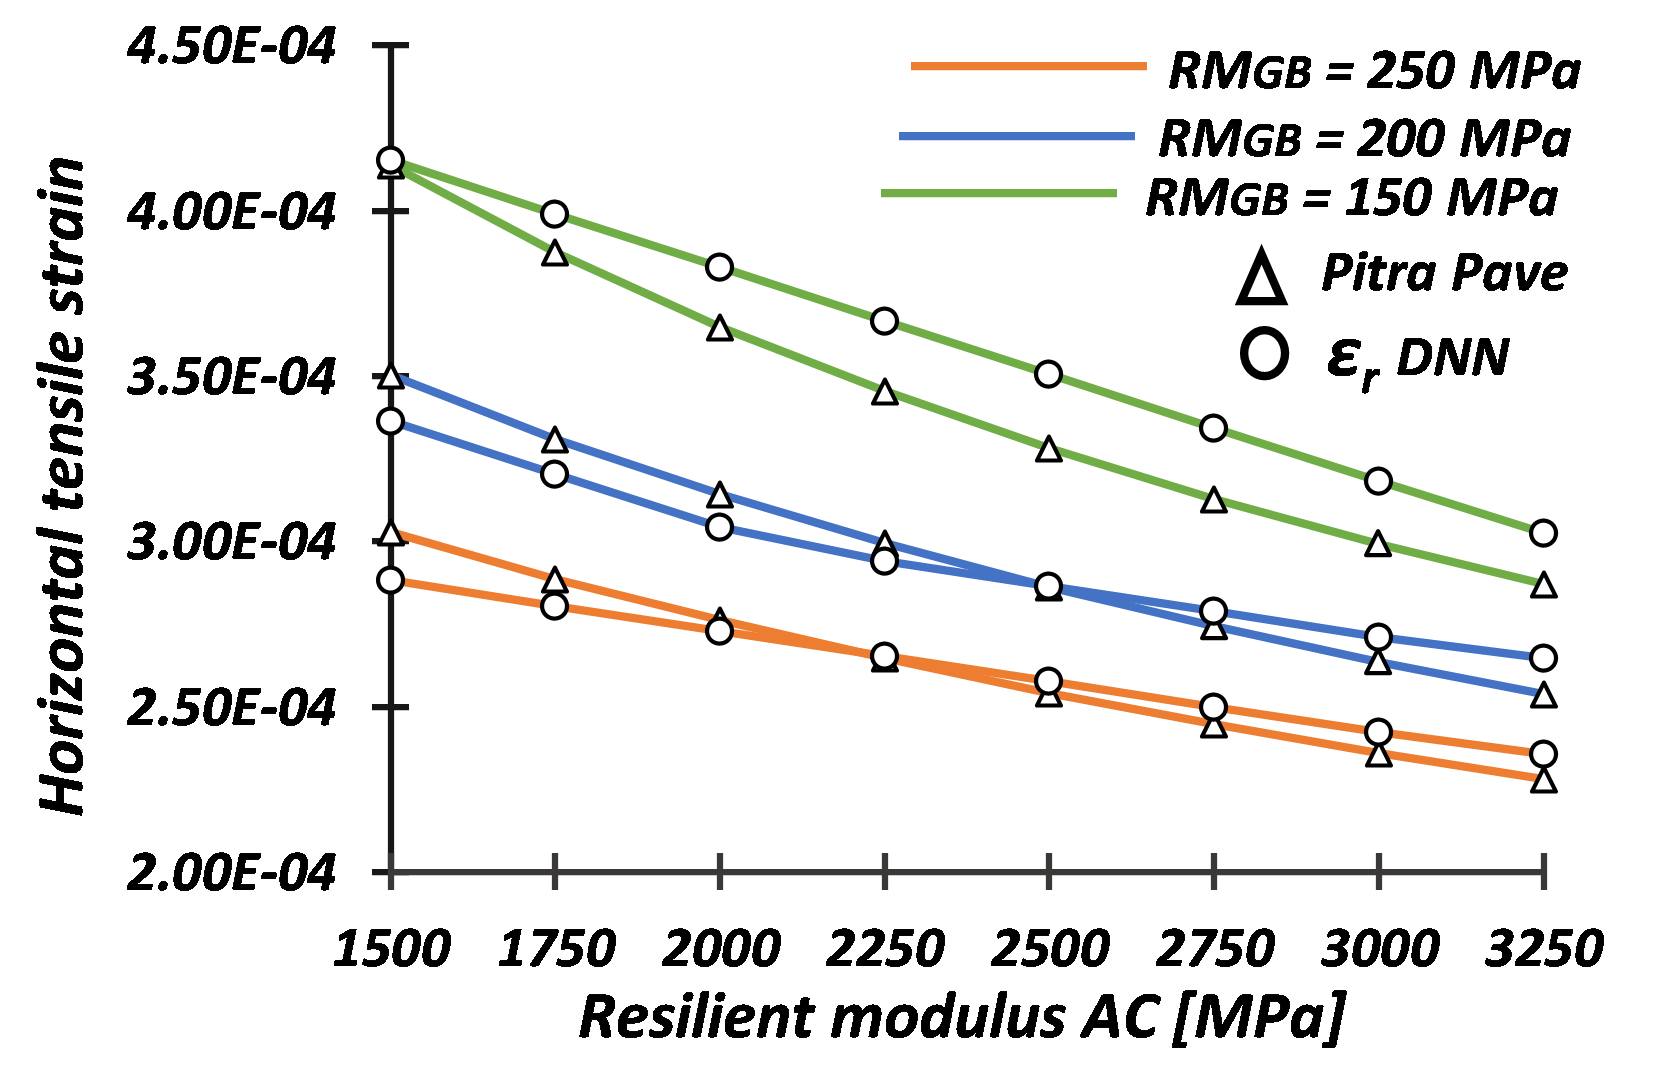
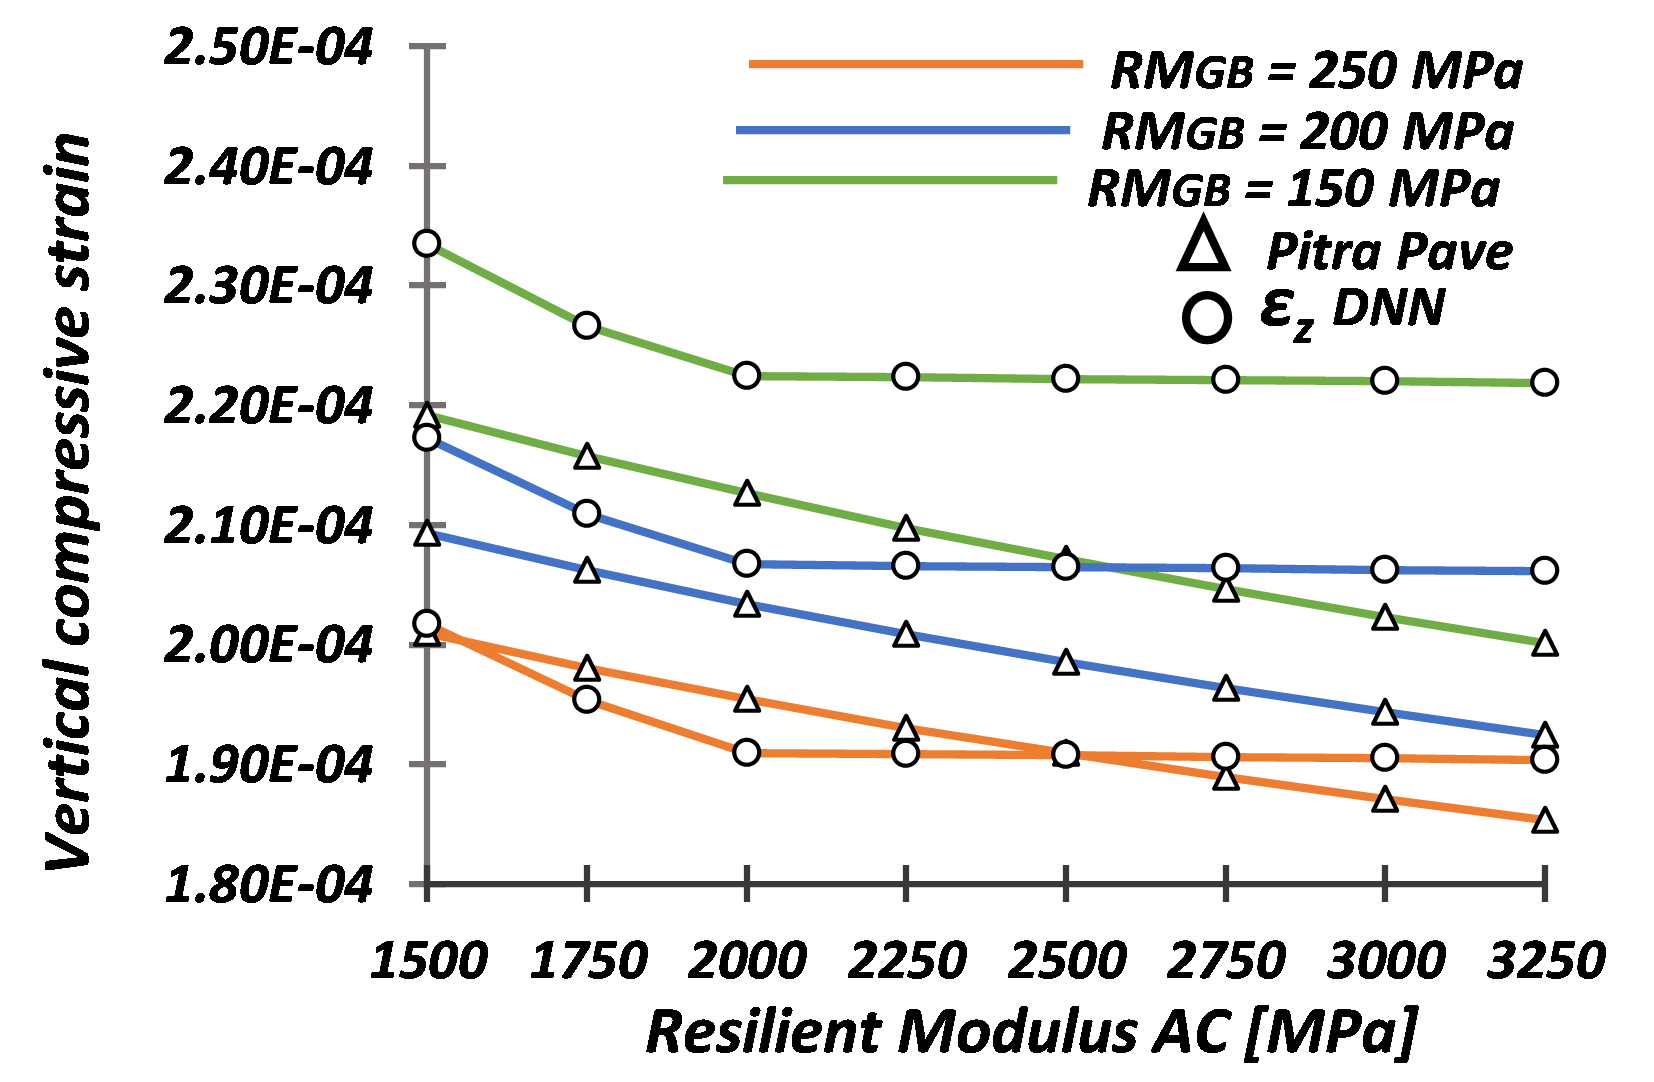
In addition, a direct comparison was made between the predictions of the DNN model and the results from the Pitra Pave® software for the three structural design parameters evaluated. Fig. 4 displays the outcomes for these criteria, indicating that the DNN models' predictions followed the trends of the MET model. The prediction results for \(\Delta_z\) (Fig. 4A) from both models exhibited smaller than 5% differences.
Thus, an initial assessment of the sensitivity level was conducted, considering the variation of RMGB (ranging from 150 MPa to 250 MPa) and RMAC (ranging from 1500 MPa to 3250 MPa). The results for \(\varepsilon_r\) and \(\varepsilon_z\) were determined at the central point of the circular load imprint and are recorded in Table 6.
Fig. 5 shows the values of \(\Delta_z\) as a function of RMAC. The figure presents three possible mechanical responses, each defined by a variation in RMGB for different pavement structures. Generally, and as expected at the theoretical level, an inversely proportional trend between layer stiffness and surface deflection is observed.
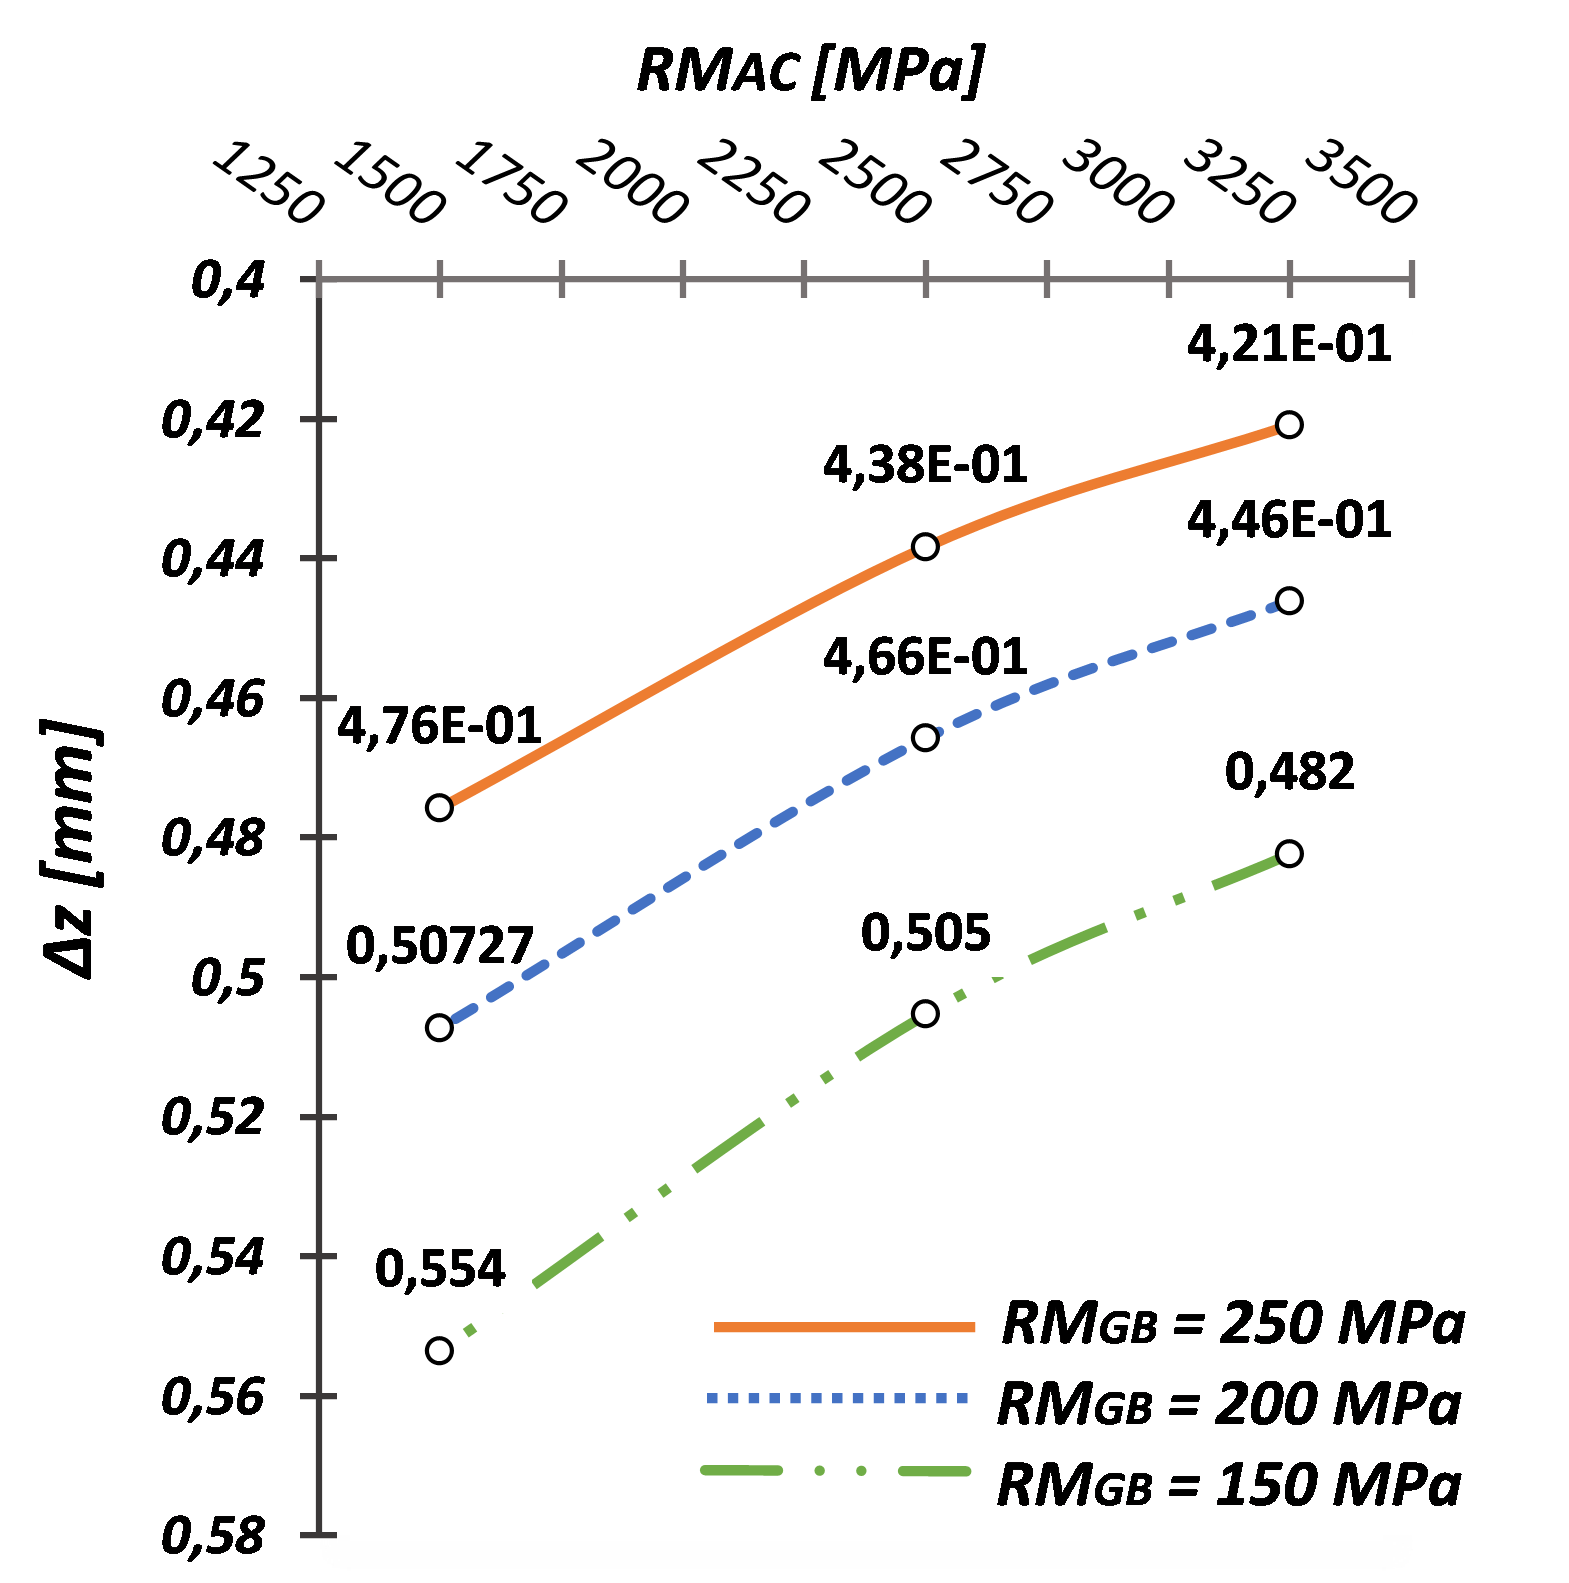
Table 7 presents the percentage differences for each design criterion evaluated after modifying the values of RMGB and RMAC. Similarly, Table 8 includes the differences found when varying the values of RMSGB and RMAC. Quantification of these differences was based on comparison with the reference pavement structure. The differences reported in Tables 7 and 8 reflect the inverse proportionality in the structural design parameters with the variations applied to RMBG and RMSGB.
Table 9 presents the percentage differences in the design parameters—calculated from the comparison with the responses of the reference pavement structure—generated when modifying the LTtotal and RMAC. These values reflected a high influence of the variation in layer thicknesses corresponding to the geometric configurations presented in Table 1. An inversely proportional trend is observed for the structural design parameters \(\Delta_z\) and \(\varepsilon_r\).
However, there wasn't a consistent trend in εr for the geometric configurations assessed. The values of this design parameter calculated for LTtotal=0,60 m, LTtotal=0,47 m, and LTtotal=0,35 m showed a decreasing trend with increasing RMAC and LTtotal. However, an increasing trend was evidenced for the structure with LTtotal=0,23 m. This response was because when the thickness of the AC layer was on the order of 3 cm and its resilient modulus decreased, stresses tended to increase due to the lack of load distribution capacity.
Sandoval-Higuera (2006) presented a scale for percent variations to classify the results obtained and listed above. This sensitivity scale is shown in Table 11. Table 12 presents the degree of sensitivity of the design variables evaluated. According to these results, the sensitivity assessment for the three structural design parameters suggests that the most influential variable was LTtotal.
Table 13 presents the connection weights between neurons for the different design variables concerning the evaluated structural design parameters. It is worth noting that for the training of the DNN models, each of the initially characterized layer thicknesses in each structural layer was treated independently. This approach allowed for the measurement of influence through the connection weights for each layer thickness, whereas for the analysis performed by the MET model, the total layer thickness (LTtotal) conceptualized in each initially defined geometric configuration was considered.
The results from both models (DNN and MET) showed some variations in the sensitivity level of the design variables for each structural design parameter. However, in both cases, it was consistently found that layer thicknesses were the most significant variables.
The developed Deep Learning models achieved satisfactory metrics of R2 and RSME, suggesting their capability for prediction and generalization regarding structural design parameters (i.e., surface deflection, horizontal tensile strain at the bottom of the AC, and vertical strain due to compression at the surface of the SG).
The numerical estimates computed by the MET and DNN models enabled the determination of the sensitivity level of each design variable in the flexible pavements assessed for LVTR. The outcome was consistent, comparing the MET model results and the connection weights from the DDN models; i.e., layer thicknesses exert the greatest influence on each evaluated structural design parameter for the pavement structures characterized. However, the DNN models were able to determine a more detailed breakdown of this sensitivity level in terms of thickness for each structural layer.
For future work, exploring a more significant number of simulations is suggested to allow for a more robust generalization of the DNN models and thereby improve the metrics. In addition, it is essential to assess other analysis points besides the midpoint under the tire imprint (e.g., the middle point between the circular tire imprints), which can also lead to critical values of the structural design parameters. Lastly, validation of DNN models prediction for the vertical and horizontal strains and deflections throughout the depth of the pavement structures is of interest to enhance the optimal generalization for each variable in developing a multi-predictor DNN model.
Alejandra, M., Ariza, A., Alejandro, P., & Romero, A. (2017). Las vías terciarias en Colombia, una oportunidad para la ingeniería vial y el desarrollo del país. Universidad Catolica.
Caro, S., & Caicedo, B. (2017). TECNOLOGÍAS PARA VÍAS TERCIARIAS: PERSPECTIVAS Y EXPERIENCIAS DESDE LA ACADEMIA. Revista de Ingeniería, 45. https://doi.org/10.16924/revinge.45.3
Coria Gutiérrez, C. A., Hernández Domínguez, R. I. ;, & Garnica Anguas, P. (2018). Teorías para calcular esfuerzos, deformaciones y deflexiones en pavimentos flexibles: un enfoque mecanicista. In IMT Instituto Mexicano del Transporte (Issue 72).
Corté, J. F., & Goux, M. T. (1996). Design of pavement structures: The French technical guide. Transportation Research Record, 1539. https://doi.org/10.3141/1539-16
Ghanizadeh, A. R., & Ahadi, M. R. (2015). Application of artificial neural networks for analysis of flexible pavements under static loading of standard axle. International Journal of Transportation Engineering, 3(1).
Ghanizadeh, A. R., Heidarabadizadeh, N., & Jalali, F. (2020). Artificial neural network back-calculation of flexible pavements with sensitivity analysis using Garson's and connection weights algorithms. Innovative Infrastructure Solutions, 5(2). https://doi.org/10.1007/s41062-020-00312-z
Gopalakrishnan, K. (2018). Deep learning in data-driven pavement image analysis and automated distress detection: A review. In Data (Vol. 3, Issue 3).
Kingma, D. P., & Ba, J. (2014). Adam: A method for stochastic optimization. ArXiv Preprint ArXiv:1412.6980.
Loría-Salazar, L. G., Aguiar-Moya, J. P., Trejos-Castillo, C., & Rojas-Pérez, F. (2017). Solución a la teoría de multicapa elástica y software de cálculo de las respuestas del pavimento PITRA PAVE.
Massenlli, G. S. R., & Paiva, C. E. L. de. (2019). Influencia de la deflexión superficial en pavimentos flexibles con subrasante de baja resistencia. Ingeniare. Revista Chilena de Ingeniería, 27(4).
Pereira, P., & Pais, J. (2017). Main flexible pavement and mix design methods in Europe and challenges for the development of an European method. In Journal of Traffic and Transportation Engineering (English Edition) (Vol. 4, Issue 4). https://doi.org/10.1016/j.jtte.2017.06.001
Plati, C., Georgiou, P., & Papavasiliou, V. (2016). Simulating pavement structural condition using artificial neural networks. Structure and Infrastructure Engineering, 12(9). https://doi.org/10.1080/15732479.2015.1086384
Rondón Quintana, H. A., & Reyes Lizcano, F. A. (2007). Metodologías de diseño de pavimentos flexibles: Tendencias, alcances y limitaciones. Ciencia e Ingeniería Neogranadina, 17(2). https://doi.org/10.18359/rcin.1074
Sandoval, Higuera;Hernando, C. (2006). Análisis de sensibilidad de las variables de diseño de un pavimento rígido y su incidencia en la deflexión. Facultad de Ingeniería, 15(20).
Yang, X., Guan, J., Ding, L., You, Z., Lee, V. C. S., Mohd Hasan, M. R., & Cheng, X. (2021). Research and applications of artificial neural network in pavement engineering: A state-of-the-art review. In Journal of Traffic and Transportation Engineering (English Edition) (Vol. 8, Issue 6).
Keywords: Deep neural network, sensitivity analysis, multilayer elastic theory, flexible pavements.
Resumen: El objetivo de este estudio es implementar redes neuronales profundas (RNPs) para evaluar la sensibilidad de parámetros de diseño en pavimentos flexibles de carreteras con bajo volumen de tráfico. Ciento ocho estructuras fueron modeladas utilizando el programa Pitra Pave® (modelo de teoría elástica multicapa (TEM) para análisis estructural de pavimentos) para generar la base de datos requerida para desarrollar las RNPs. Estas redes, a través de pesos de conexión, permitieron la comparación con TEM para evaluar la sensibilidad de las variables de diseño (módulo resiliente y espesor de capa) sobre los parámetros de diseño estructural. Los resultados sugieren el impacto significativo de los espesores de capa. Adicionalmente, las predicciones de los parámetros de diseño estructural obtenidos mediante las RNPs variaron entre 0,03% y 10,87% respecto a TEM. Para futuras investigaciones, se sugiere ampliar la base de datos y desarrollar una red multi-predictiva.
Palabras clave: Red neuronal profunda, análisis de sensibilidad, teoría elástica multicapa, pavimentos flexibles.
1. INTRODUCTION
Low-volume traffic roads (LVTR) in Colombia are encompassed within the national classification as tertiary roads. These roads connect populated centers and rural areas (INVIAS, 2008). As of 2017, different entities estimated 142,000 km of LVTR in the country. For the same period, it was reported that only 6% were in good condition, while the remaining 94% of LVTR nationwide predominantly exhibited regular, poor, and bad conditions (Ariza & Romero, 2017). These figures are a consequence, among other factors, of the lack of implementation of new technologies, particularly in the construction and maintenance phases (Caro & Caicedo, 2017). Nevertheless, pavement structural design is a fundamental pillar in developing new roads, and recent advancements in this area can significantly benefit the planning and construction of these roads.Theories for flexible pavement structural design currently include several approaches, from empirical to mechanistic (or rational) methods considering materials' visco elastoplastic non-linear behavior (Pereira & Pais, 2017). In addition, mechanistic methods based on multilayered elastic theory (MET) quantify the pavement structural response in terms of deformations and stresses on the principle that each material exhibits linear elastic behavior.
Furthermore, traditional mechanistic methods for flexible pavement design rely on controlling two response parameters: the horizontal tensile strain at the bottom of the asphalt concrete and vertical compression strain at the subgrade surface (Coria Gutiérrez et al., 2018), which are, respectively, associated with bottom-up fatigue cracking in the asphalt concrete and subgrade rutting (i.e., plastic deformation). The structural response of flexible pavements can also be evaluated based on another widely studied design criterion: surface deflection (Massenlli & Paiva, 2019).
Computational programs have supported mechanistic design approaches since the 1960s. These software include Bisar®, Kenpave®, Elsym5®, Pitra Pave®, and EVERSTRESS, among others. Furthermore, over the years, the software has been developed to model pavement structures using the finite element method, which enables the solution of constitutive equations for assessing stresses and strains (Rondón Quintana & Reyes Lizcano, 2007).
On the other hand, with the evolution of computational systems, artificial intelligence has become one of the main drivers in transforming research approaches across various fields of knowledge. In civil engineering, significant enhancements in accuracy, efficiency, and cost-effectiveness have been reported at different stages of projects. Specifically, in pavement engineering, various approaches have been considered, ranging from machine learning to deep learning (Gopalakrishnan, 2018); the latter includes neural networks that offer robust prediction tools and streamline various processes (Yang et al., 2021).
This study seeks to assess the level of sensitivity of design variables on the structural design parameters of flexible pavements for LVTR based on a deep neural network (DNN) for each structural design parameter. The predictor DNN models were constructed using synthetically generated data from the Pitra Pave® software (Loría-Salazar et al., 2017), which models flexible pavement structures based on the multilayer elastic theory (MET). The variables assessed in this study correspond to the primary structural design parameters evaluated in mechanistic design methods (Corté & Goux, 1996). These are horizontal tensile strain at the bottom of the asphalt concrete layer (\(\varepsilon_r\)), vertical compressive strain at the surface of the subgrade (\(\varepsilon_z\)), and surface deflection (\(\Delta_z\)). However, besides assessing the structural design parameters, the MET model allowed computing the deflection (vertical deformation), vertical strain, and horizontal strain at different depths. These data permitted additional refinement for the development of the DNN models.
These DNN models allowed for assessing the significance of the design variables (resilient modulus and layer thickness of each structural layer), determined by the connection weights between neurons, acquired during the learning process. Ultimately, these connection weights were compared with an assessment of the sensitivity level conducted using data from 108 simulations (16200 data) using the MET model (i.e., Pitra Pave® software), enabling the determination of the influence of design variables on typical pavement structural design parameters. The DNN models can help to determine structural design parameters for multiple pavement structures for LVTR in analysis conducted at the road network level. The options for these structures are constrained by the ranges established for the design variables evaluated.
2. METHODOLOGY
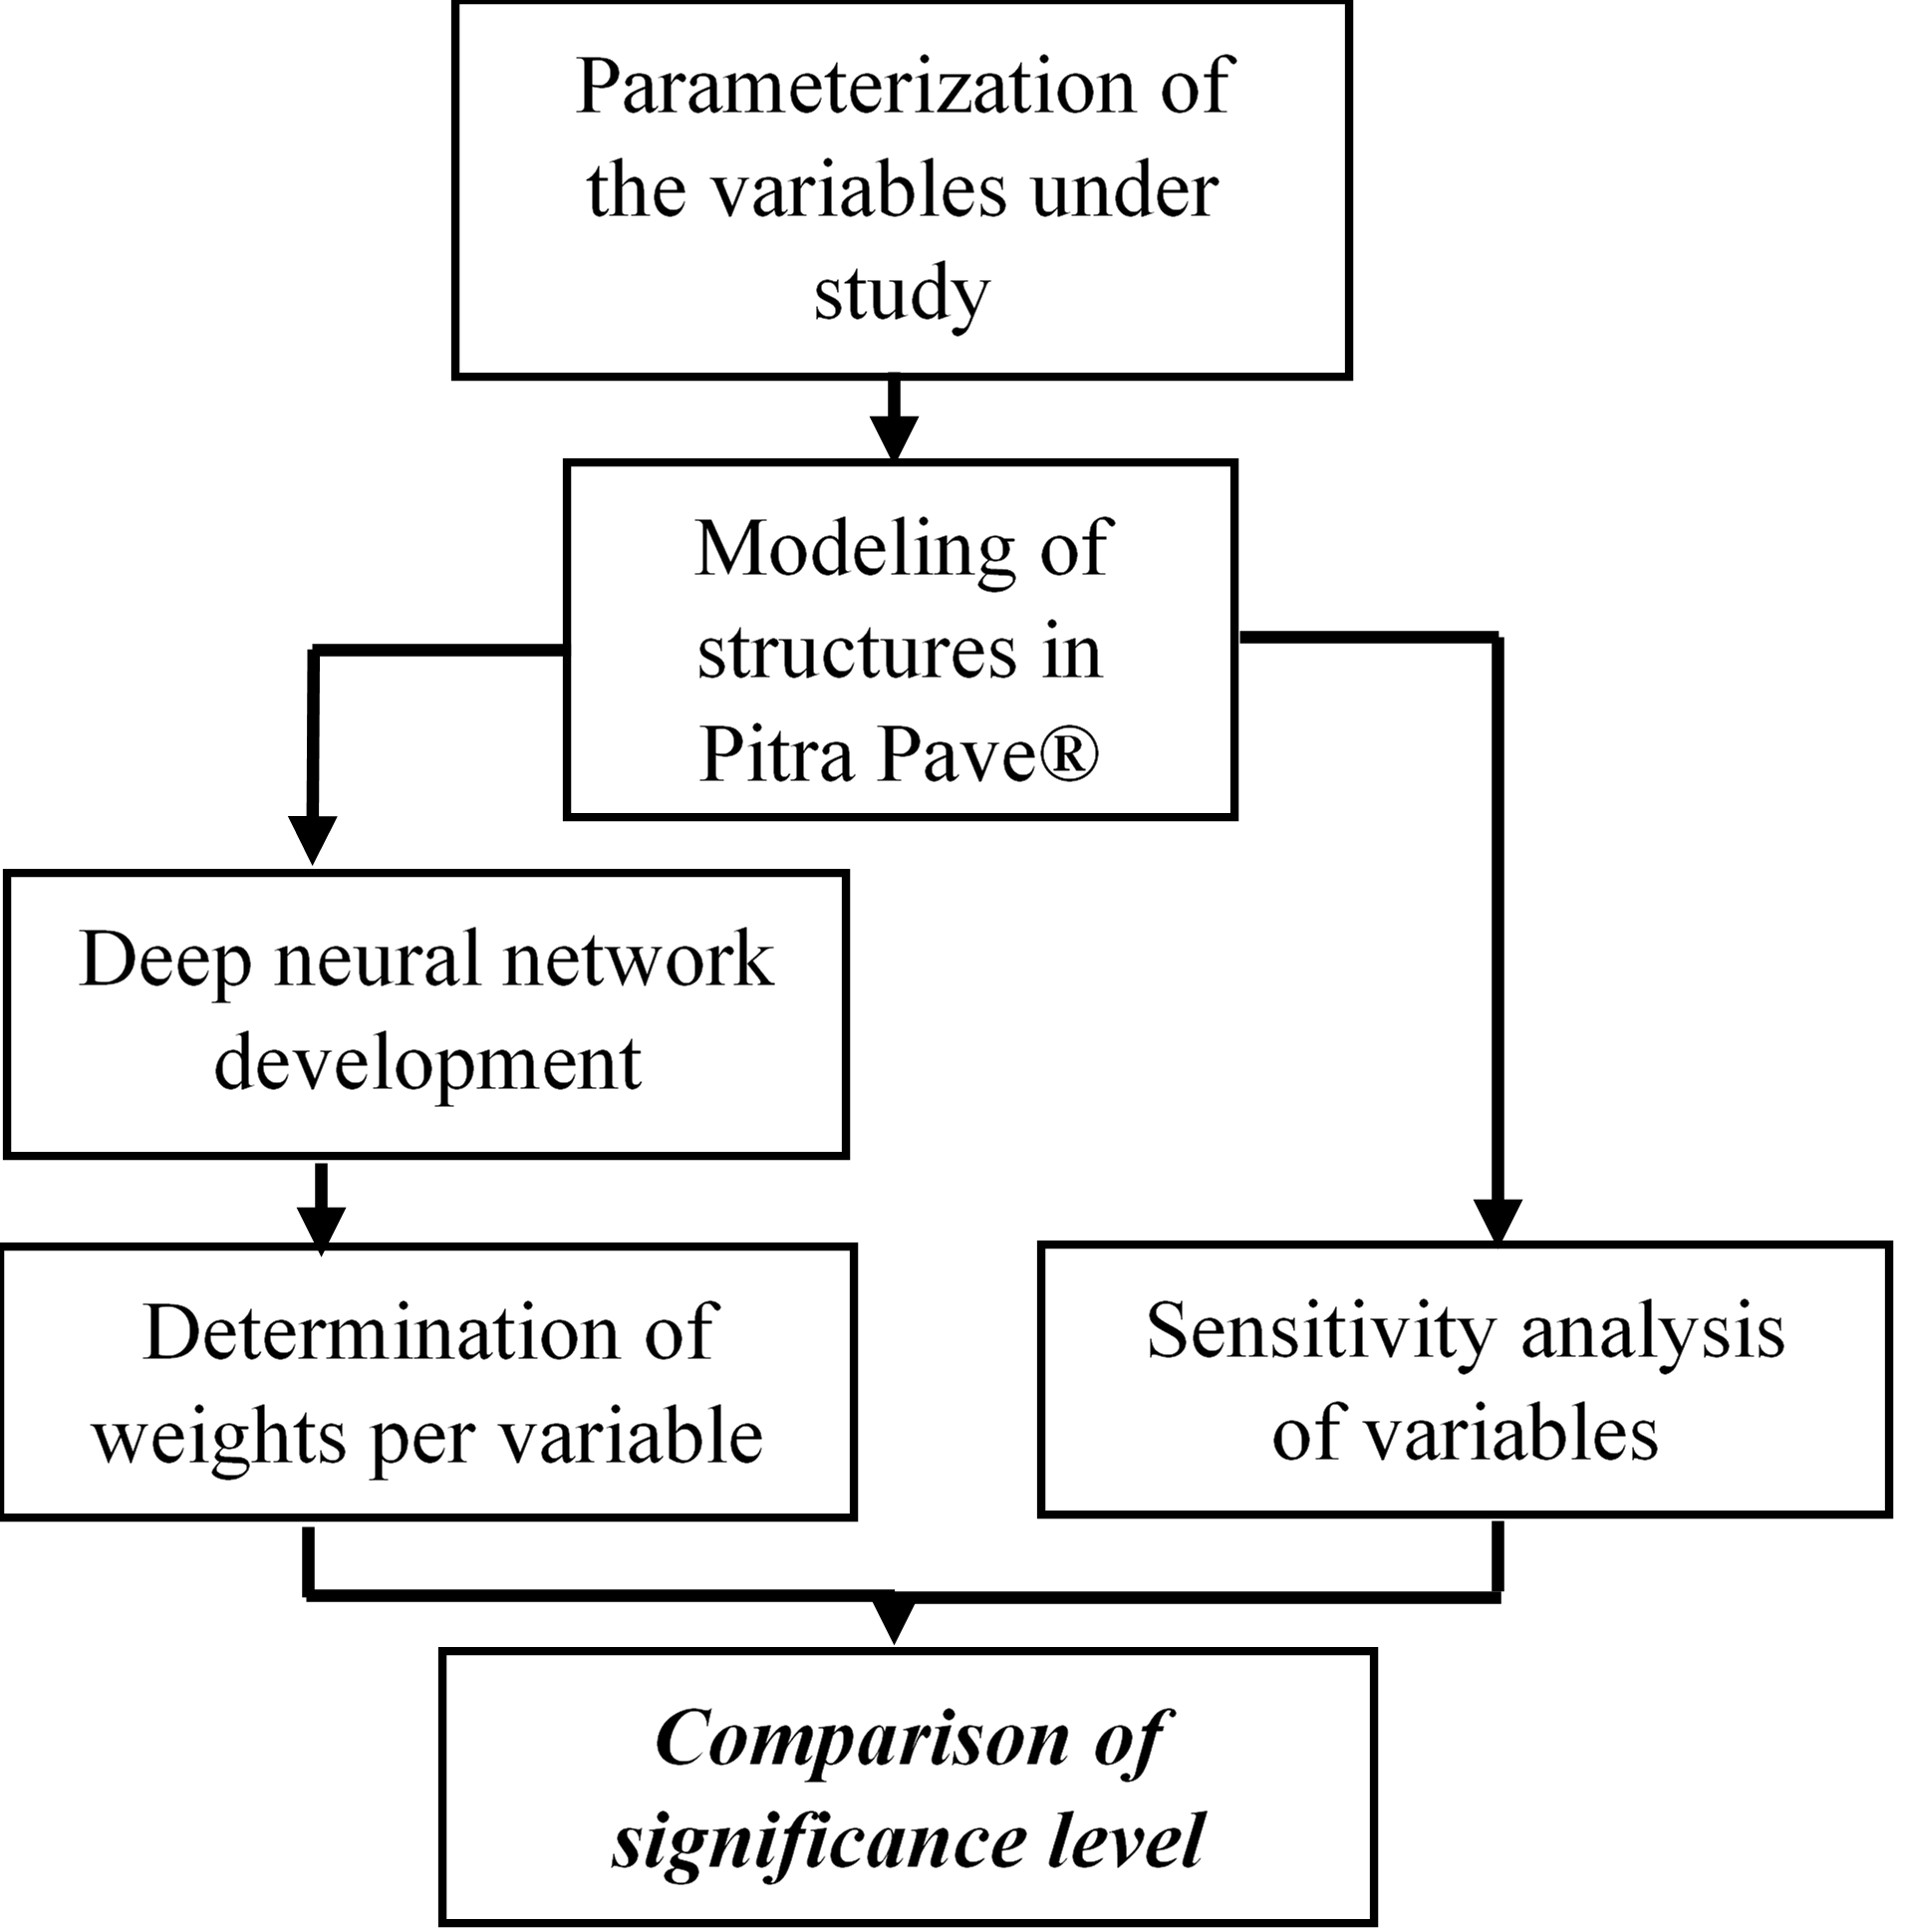
The working scheme applied in this research is outlined in Fig. 1. It primarily stemmed from the selection of 108 flexible pavement structures, resulting from a parameterization of the resilient modulus (RM) and layer thickness (LT) for each of the structural layers that comprised a typical flexible pavement structure. Next, a modeling stage was carried out using the Pitra Pave® software, which provided the necessary data for assessing the sensitivity level and developing the DNN models. Subsequently, validations were performed by directly comparing the outputs gathered from the DNN models and MET models. Afterward, an evaluation was conducted on the differences observed in the various pavement structures for each structural design parameter to determine the significance of the design variables. Finally, the DNN models yielded the connection weights per design variable needed to compare the level of importance of each of these parameterized variables.
Fig. 1. Methodology applied for conducting the study.
2.1. Design parameters
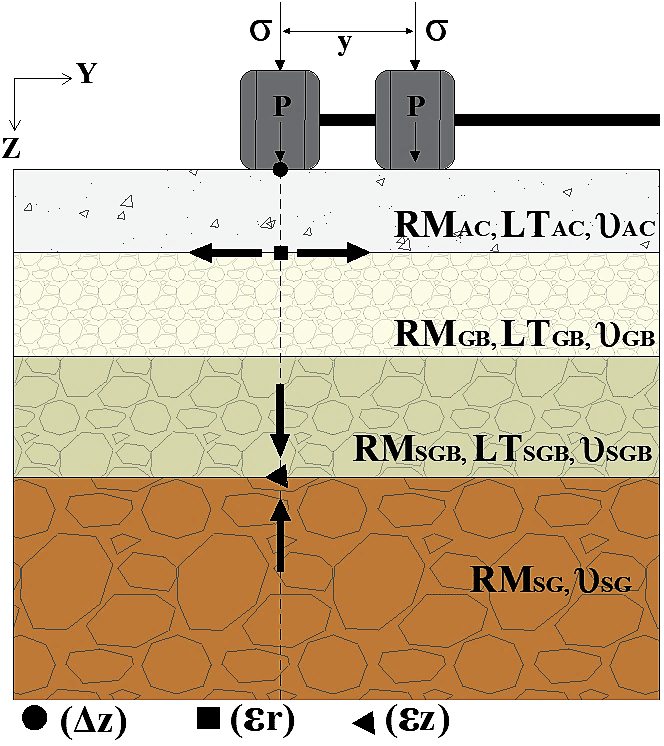
The typical flexible pavement structure adopted is shown in Fig. 2, including the subgrade (SG) and three structural layers: asphalt concrete (AC), granular base (GB), and granular sub-base (GSB). The design parameters that differentiated each pavement structure were the thickness of AC (LTAC), the thickness of GB (LTGB), the thickness of GSB (LTGSB), the resilient modulus (stiffness) of AC (RMAC), the resilient modulus of GB (RMGB), and the resilient modulus of GSB (RMGSB). By varying the thicknesses, it was possible to establish four geometric configurations (C1, C2, C3, C4; Table 1), while for the moduli, the values indicated in Table 1 were adopted. These values generated different combinations, defining the 108 simulated structures. Additionally, the Poisson's ratio (υ) and resilient modulus of the subgrade (RMSG), tire load (P), contact pressure between the tire and the pavement (σ), radius of the load area (r), and tire spacing (y) remained constant. Table 2 presents the values adopted for these parameters.
Fig. 2. Reference structural model.
Tabla 1: descripción
| Layer | Resilient modulus [MPa] | Layer thickness [m] | |||
|---|---|---|---|---|---|
| C1 | C2 | C3 | C4 | ||
| AC | 3500 - 2500 -1500 | 0,10 | 0,07 | 0,05 | 0,03 |
| GB | 250 - 200 - 150 | 0,25 | 0,20 | 0,15 | 0,10 |
| SGB | 200 - 150 - 100 | 0,25 | 0,20 | 0,15 | 0,10 |
| SG | 80 | - | - | - | - |
Note. The Pitra Pave® software assumes the subgrade layer thickness (LTSG) to be infinite.
Table 2: Constants adopted in the pavement structural models.
| Parameter | Value |
|---|---|
| υAC | 0,30 |
| υGB, υSGB, and υSG | 0,35 |
| RMSG [MPa] | 80,00 |
| r [m] | 0,108 |
| y [m] | 0,324 |
| P [kN] | 20,50 |
| σ [kPa] | 562,00 |
2.2. Deep Neural Network (DNN) models
By modeling pavement structures using the Pitra Pave® software, it was possible to evaluate the structural design parameters at the position corresponding to the midpoint under the tire imprint. This effort resulted in a dataset of 16200 entries, which was the foundation for constructing an initial predictor DNN model for each pavement structural design parameter.The architectures of each proposed DNN were developed using a subset of the database obtained from modeling pavement structures with Pitra Pave®. The synthetic database was randomly divided into three subsets necessary for developing each DNN (Table 3). The architecture of each DNN model was trained using the adaptive moment estimation––Adam––optimizer (Kingma & Ba, 2014) with default parameters, except for the learning rate, which was varied and decreased by a factor of 0,8 when performance stabilized. The early stopping regularization technique was implemented to prevent overfitting by monitoring the loss on the validation test, and a 5-fold stratified approach was used to evaluate the model's performance and generalization capability.
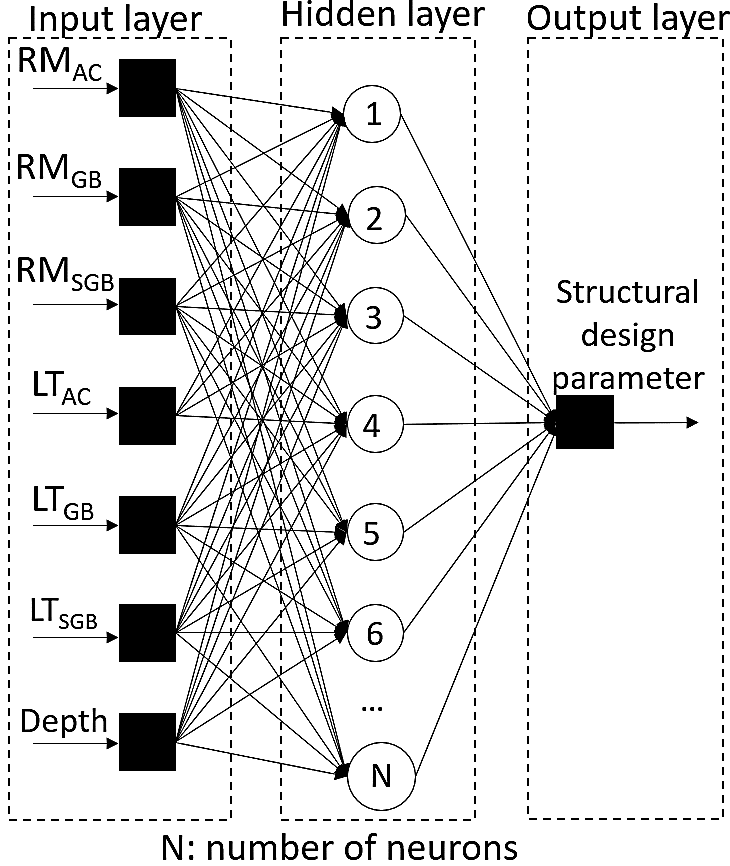
For hyperparameter tuning, this study explored various combinations of the number of hidden layers, the number of neurons, and the activation functions. The selected architectures achieved the highest performance on the test set. The metrics used to evaluate the DNN models were the coefficient of determination (R2) and the root mean square error (RMSE). Fig. 3 presents the general scheme of the DNN architectures used, and Table 4 summarizes the number of neurons selected in the architectures of each DNN model. All hidden layers in the three DNN models used the rectified linear units—ReLU—activation function.
Fig. 3. Reference architecture of DNN models.
Table 3: Proportions of data subsets used for each DNN model.
| Training | Test | Validation | |
|---|---|---|---|
| \(\Delta_z\) DNN | 70 | 30 | 20 |
| \(\varepsilon_r\) DNN | 70 | 30 | 20 |
| \(\varepsilon_z\) DNN | 85 | 15 | 10 |
Table 4: Number of neurons implemented for each DNN model.
| Hidden layer 1 | Hidden layer 2 | |
|---|---|---|
| \(\Delta_z\) DNN | 180 | - |
| \(\varepsilon_r\) DNN | 100 | 120 |
| \(\varepsilon_z\) DNN | 60 | 180 |
3. RESULTS AND DISCUSSION
The results of the study included the analysis of accuracy and empirical validation of the DNN models, variation of the structural design parameters due to the change in the design variables, the sensitivity level of the design variables to the structural design parameters, and significance level of design variables determined from the DNN models.3.1. Accuracy and empirical validation of the DNN models
Table 5 presents the values obtained for the R2 and RMSE metrics, compared to results found in the literature. These metrics demonstrated the accuracy achieved on test data, i.e., not used in the training phase. Overall, these values support the proper performance of the proposed DNN models in estimating and generalizing structural design parameters. Differences compared to the Pitra Pave® (MET) outputs are subsequently discussed.Table 5. Performance metrics of the DNN models.
| Model | R2 | RSME | |
|---|---|---|---|
| \(\Delta_z\) DNN | Proposed | 0,998 ± 0,002 | 0,0029 ± 0,006 |
| Karballaeezadeh et al., 2020 | 0,841 | 0,76 | |
| \(\varepsilon_r\) DNN | Proposed | 0,996 ± 0,027 | 1,09E-5 ± 0.016 |
| (Plati et al., 2016) | 0,96 ± 0,003 | 0,043 ± 0,0001 | |
| \(\varepsilon_z\) DNN | Proposed | 0,988 ± 0,006 | 4,24E-5 ± 0,0066 |
| (Ghanizadeh & Ahadi, 2015) | 0,99 |
In addition, a direct comparison was made between the predictions of the DNN model and the results from the Pitra Pave® software for the three structural design parameters evaluated. Fig. 4 displays the outcomes for these criteria, indicating that the DNN models' predictions followed the trends of the MET model. The prediction results for \(\Delta_z\) (Fig. 4A) from both models exhibited smaller than 5% differences.
(A)
(B)
(C)
Fig. 4. Influence of resilient modulus of asphalt concrete and granular base on structural design parameters: (A) surface deflection, (B) horizontal strain at the bottom of the asphalt concrete, and (C) vertical strain at the top of the subgrade.
The corresponding results for εr estimation (Fig. 4B) showed maximum differences ranging from 0,04 to 5,07%, a promising outcome for this initial DNN model, suggesting the potential for further refinement to minimize the reported discrepancies. Fig. 4C presents the DNN predicted values for εz, showing a percentage difference ranging from 0,66% to 5,50%. These discrepancies indicated that the DNN model also provided a promising initial prediction for this design parameter.3.2. Variation of the structural design parameters due to the change in the design variables
Assessment of the sensitivity level for each structural design parameter required defining a reference pavement structural model, from which the differences generated by the variation of RM and LT were calculated. The selected reference pavement structural model is depicted in Fig. 2, and it was characterized by RMAC=3250 MPa, RMGB=250 MPa, RMSGB=200 MPa, and RMSG=80 MPa, along with layer thicknesses defined for geometry C1 (LTCA=0,10 m; LTGB=0,25 m; LTSGB=0,25 m).Thus, an initial assessment of the sensitivity level was conducted, considering the variation of RMGB (ranging from 150 MPa to 250 MPa) and RMAC (ranging from 1500 MPa to 3250 MPa). The results for \(\varepsilon_r\) and \(\varepsilon_z\) were determined at the central point of the circular load imprint and are recorded in Table 6.
Table 6: Results of structural design parameters associated with variations in RMGB and RMCA.
| RMAC [MPa] | RMGB [MPa] | \(\varepsilon_r\) | \(\varepsilon_z\) |
|---|---|---|---|
| 3250* | 250* | 2,28E-04 | 1,85E-04 |
| 200 | 2,54E-04 | 1,92E-04 | |
| 150 | 2,87E-04 | 2,00E-04 | |
| 2500 | 250* | 2,54E-04 | 1,91E-04 |
| 200 | 2,86E-04 | 1,99E-04 | |
| 150 | 3,28E-04 | 2,07E-04 | |
| 1500 | 250* | 3,03E-04 | 2,01E-04 |
| 200 | 3,50E-04 | 2,09E-04 | |
| 150 | 4,14E-04 | 2,19E-04 |
* Reference model values.
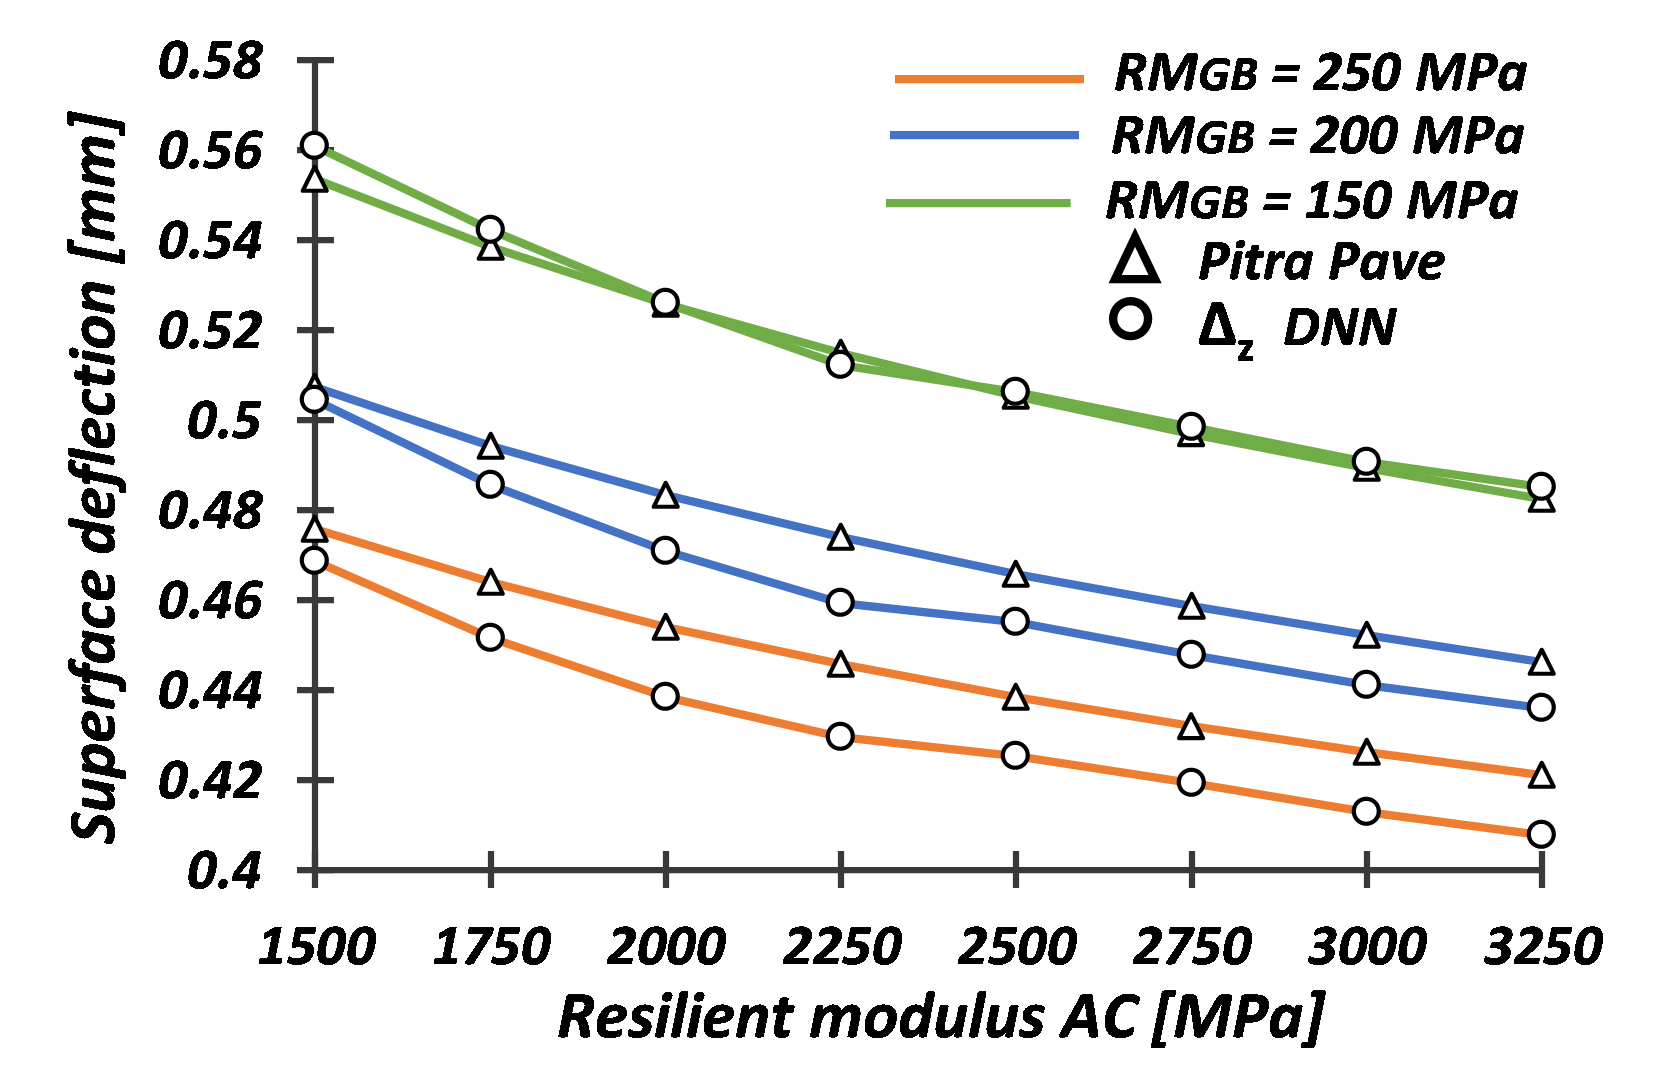
Fig. 5 shows the values of \(\Delta_z\) as a function of RMAC. The figure presents three possible mechanical responses, each defined by a variation in RMGB for different pavement structures. Generally, and as expected at the theoretical level, an inversely proportional trend between layer stiffness and surface deflection is observed.
Fig. 5. Surface deflection as a function of RMAC and different values of RMGB.
Table 7 presents the percentage differences for each design criterion evaluated after modifying the values of RMGB and RMAC. Similarly, Table 8 includes the differences found when varying the values of RMSGB and RMAC. Quantification of these differences was based on comparison with the reference pavement structure. The differences reported in Tables 7 and 8 reflect the inverse proportionality in the structural design parameters with the variations applied to RMBG and RMSGB.
Table 7. Variation of structural design parameters after changing RMGB and RMAC.
| RMAC [MPa] | RMGB [MPa] | \(\Delta_z\) [%] | \(\varepsilon_r\) [%] | \(\varepsilon_z\) [%] |
|---|---|---|---|---|
| 3250* | 250* | 0,00 | 0,00 | 0,00 |
| 200 | 5,94 | 11,40 | 3,78 | |
| 150 | 14,49 | 25,88 | 8,11 | |
| 2500 | 250* | 0,00 | 0,00 | 0,00 |
| 200 | 6,39 | 12,60 | 4,19 | |
| 150 | 15,30 | 29,13 | 8,38 | |
| 1500 | 250* | 0,00 | 0,00 | 0,00 |
| 200 | 6,51 | 15,51 | 3,98 | |
| 150 | 16,39 | 36,63 | 8,96 |
* Reference model values.
Table 8. Variation of structural design parameters after changing RMSGB and RMAC.
| RMAC [MPa] | RMSGB [MPa] | \(\Delta_z\) [%] | \(\varepsilon_r\) [%] | \(\varepsilon_z\) [%] |
|---|---|---|---|---|
| 3250* | 200* | 0,00 | 0,00 | 0,00 |
| 150 | 4,30 | 1,75 | 15,68 | |
| 100 | 11,05 | 4,39 | 42,16 | |
| 2500 | 200* | 0,00 | 0,00 | 0,00 |
| 150 | 4,27 | 1,57 | 15,18 | |
| 100 | 11,02 | 3,94 | 42,41 | |
| 1500 | 200* | 0,00 | 0,00 | 0,00 |
| 150 | 4,20 | 1,00 | 15,90 | |
| 100 | 10,80 | 2,60 | 43,30 |
* Reference model values.
Table 9 presents the percentage differences in the design parameters—calculated from the comparison with the responses of the reference pavement structure—generated when modifying the LTtotal and RMAC. These values reflected a high influence of the variation in layer thicknesses corresponding to the geometric configurations presented in Table 1. An inversely proportional trend is observed for the structural design parameters \(\Delta_z\) and \(\varepsilon_r\).
Table 9: Variation of structural design parameters with changes in LTtotal and RMAC.
| RMAC [MPa] | LTtotal [m] | \(\Delta_z\) [%] | \(\varepsilon_r\) [%] | \(\varepsilon_z\) [%] |
|---|---|---|---|---|
| 3250* | 0,60* | 0,00 | 0,00 | 0,00 |
| 0,47 | 20,98 | 22,37 | 50,81 | |
| 0,35 | 45,52 | 32,89 | 132,97 | |
| 0,23 | 83,68 | 7,46 | 320,54 | |
| 2500 | 0,60* | 0,00 | 0,00 | 0,00 |
| 0,47 | 20,07 | 18,90 | 49,21 | |
| 0,35 | 43,50 | 23,62 | 130,37 | |
| 0,23 | 79,27 | 12,20 | 314,14 | |
| 1500 | 0,60* | 0,00 | 0,00 | 0,00 |
| 0,47 | 18,14 | 10,89 | 47,76 | |
| 0,35 | 39,14 | 3,96 | 126,87 | |
| 0,23 | 70,23 | 44,55 | 305,97 |
* Reference model values.
However, there wasn't a consistent trend in εr for the geometric configurations assessed. The values of this design parameter calculated for LTtotal=0,60 m, LTtotal=0,47 m, and LTtotal=0,35 m showed a decreasing trend with increasing RMAC and LTtotal. However, an increasing trend was evidenced for the structure with LTtotal=0,23 m. This response was because when the thickness of the AC layer was on the order of 3 cm and its resilient modulus decreased, stresses tended to increase due to the lack of load distribution capacity.
3.3. Sensitivity level of the design variables to the structural design parameters
By assessing the sensitivity level of the design variables on the structural design parameters analyzed in flexible pavement structures, their level of sensitivity could be evaluated, classified, and organized from highest to lowest influence concerning the calculated percentage differences. The maximum variations obtained for each structural design parameter were organized, showing the level of impact concerning each studied design variable. Table 10 presents the maximum variations of the design variables analyzed in terms of the structural design parameters (\(\Delta_z\), \(\varepsilon_r\), and \(\varepsilon_z\)).Table 10: Maximum variations of the design variables for each structural design parameter.
| Variable | \(\Delta_z\) [%] | \(\varepsilon_r\) [%] | \(\varepsilon_z\) [%] |
|---|---|---|---|
| LTtotal | 83,68 | 44,55 | 320,54 |
| RMGB | 16,39 | 36,72 | 9,05 |
| RMAC | 13,06 | 32,70 | 8,45 |
| RMSGB | 11,05 | 4,39 | 43,28 |
Sandoval-Higuera (2006) presented a scale for percent variations to classify the results obtained and listed above. This sensitivity scale is shown in Table 11. Table 12 presents the degree of sensitivity of the design variables evaluated. According to these results, the sensitivity assessment for the three structural design parameters suggests that the most influential variable was LTtotal.
Table 11: Definition scale of sensitivity level.
| Sensitivity level | Variation [%] |
|---|---|
| Low | <15 |
| Medium | 15-30 |
| High | >30 |
Table 12: Sensitivity level of design variables on structural design parameters.
| Variable | \(\Delta_z\) | \(\varepsilon_r\) | \(\varepsilon_z\) |
|---|---|---|---|
| LTtotal | High | High | High |
| RMAC | Low | High | Low |
| RMGB | Medium | High | Low |
| RMSGB | Low | Low | High |
3.4. Significance level of design variables determined from the DNN models
The significance level of design variables computed using the DNN models was assessed in terms of the connection weights. These weights were parameters that the DNN adjusted in the training process, determining the contribution of each neuron associated with each input variable. The determination and calculation of these weights followed the approach proposed by Ghanizadeh et al., 2020. The analysis for each structural design parameter involved determining the connection weights for each hidden layer and associating the sum of these weights with each input variable (design variable).Table 13 presents the connection weights between neurons for the different design variables concerning the evaluated structural design parameters. It is worth noting that for the training of the DNN models, each of the initially characterized layer thicknesses in each structural layer was treated independently. This approach allowed for the measurement of influence through the connection weights for each layer thickness, whereas for the analysis performed by the MET model, the total layer thickness (LTtotal) conceptualized in each initially defined geometric configuration was considered.
Table 13. Connection weights of design variables determined from the DNN models.
| Variable | \(\Delta_z\) DNN | \(\varepsilon_r\) DNN | \(\varepsilon_z\) DNN |
|---|---|---|---|
| LTAC | 13,78 | 8,24 | 6,09 |
| LTGB | 8,29 | 9,07 | 6,39 |
| LTSGB | 9,24 | 8,47 | 7,72 |
| RMAC | 11,53 | 6,44 | 7,27 |
| RMGB | 12,78 | 7,85 | 6,07 |
| RMSGB | 12,70 | 8,54 | 4,56 |
The results from both models (DNN and MET) showed some variations in the sensitivity level of the design variables for each structural design parameter. However, in both cases, it was consistently found that layer thicknesses were the most significant variables.
4. CONCLUSIONS
The development of this study enabled the creation of DNN models, in evolution, for predicting typical structural design parameters of flexible pavements designed for LVTR. These DNN models allowed for assessing the sensitivity level of the structural design parameters concerning changes in design variables (i.e., stiffness and layer thicknesses).The developed Deep Learning models achieved satisfactory metrics of R2 and RSME, suggesting their capability for prediction and generalization regarding structural design parameters (i.e., surface deflection, horizontal tensile strain at the bottom of the AC, and vertical strain due to compression at the surface of the SG).
The numerical estimates computed by the MET and DNN models enabled the determination of the sensitivity level of each design variable in the flexible pavements assessed for LVTR. The outcome was consistent, comparing the MET model results and the connection weights from the DDN models; i.e., layer thicknesses exert the greatest influence on each evaluated structural design parameter for the pavement structures characterized. However, the DNN models were able to determine a more detailed breakdown of this sensitivity level in terms of thickness for each structural layer.
For future work, exploring a more significant number of simulations is suggested to allow for a more robust generalization of the DNN models and thereby improve the metrics. In addition, it is essential to assess other analysis points besides the midpoint under the tire imprint (e.g., the middle point between the circular tire imprints), which can also lead to critical values of the structural design parameters. Lastly, validation of DNN models prediction for the vertical and horizontal strains and deflections throughout the depth of the pavement structures is of interest to enhance the optimal generalization for each variable in developing a multi-predictor DNN model.
ACKNOWLEDGMENTS
The authors would like to acknowledge the financial support provided by the Vice-rectorship of Research and Extension (Project VIE 3717, "Characterization of marginal granular materials for pavements considering hydro-mechanical changes related to cycles of wetting and drying”) and the School of Civil Engineering at the Universidad Industrial de Santander, which made this research possible.REFERENCES
Instituto Nacional de Vías (2008). Manual de diseño geométrico de carreteras.Alejandra, M., Ariza, A., Alejandro, P., & Romero, A. (2017). Las vías terciarias en Colombia, una oportunidad para la ingeniería vial y el desarrollo del país. Universidad Catolica.
Caro, S., & Caicedo, B. (2017). TECNOLOGÍAS PARA VÍAS TERCIARIAS: PERSPECTIVAS Y EXPERIENCIAS DESDE LA ACADEMIA. Revista de Ingeniería, 45. https://doi.org/10.16924/revinge.45.3
Coria Gutiérrez, C. A., Hernández Domínguez, R. I. ;, & Garnica Anguas, P. (2018). Teorías para calcular esfuerzos, deformaciones y deflexiones en pavimentos flexibles: un enfoque mecanicista. In IMT Instituto Mexicano del Transporte (Issue 72).
Corté, J. F., & Goux, M. T. (1996). Design of pavement structures: The French technical guide. Transportation Research Record, 1539. https://doi.org/10.3141/1539-16
Ghanizadeh, A. R., & Ahadi, M. R. (2015). Application of artificial neural networks for analysis of flexible pavements under static loading of standard axle. International Journal of Transportation Engineering, 3(1).
Ghanizadeh, A. R., Heidarabadizadeh, N., & Jalali, F. (2020). Artificial neural network back-calculation of flexible pavements with sensitivity analysis using Garson's and connection weights algorithms. Innovative Infrastructure Solutions, 5(2). https://doi.org/10.1007/s41062-020-00312-z
Gopalakrishnan, K. (2018). Deep learning in data-driven pavement image analysis and automated distress detection: A review. In Data (Vol. 3, Issue 3).
Kingma, D. P., & Ba, J. (2014). Adam: A method for stochastic optimization. ArXiv Preprint ArXiv:1412.6980.
Loría-Salazar, L. G., Aguiar-Moya, J. P., Trejos-Castillo, C., & Rojas-Pérez, F. (2017). Solución a la teoría de multicapa elástica y software de cálculo de las respuestas del pavimento PITRA PAVE.
Massenlli, G. S. R., & Paiva, C. E. L. de. (2019). Influencia de la deflexión superficial en pavimentos flexibles con subrasante de baja resistencia. Ingeniare. Revista Chilena de Ingeniería, 27(4).
Pereira, P., & Pais, J. (2017). Main flexible pavement and mix design methods in Europe and challenges for the development of an European method. In Journal of Traffic and Transportation Engineering (English Edition) (Vol. 4, Issue 4). https://doi.org/10.1016/j.jtte.2017.06.001
Plati, C., Georgiou, P., & Papavasiliou, V. (2016). Simulating pavement structural condition using artificial neural networks. Structure and Infrastructure Engineering, 12(9). https://doi.org/10.1080/15732479.2015.1086384
Rondón Quintana, H. A., & Reyes Lizcano, F. A. (2007). Metodologías de diseño de pavimentos flexibles: Tendencias, alcances y limitaciones. Ciencia e Ingeniería Neogranadina, 17(2). https://doi.org/10.18359/rcin.1074
Sandoval, Higuera;Hernando, C. (2006). Análisis de sensibilidad de las variables de diseño de un pavimento rígido y su incidencia en la deflexión. Facultad de Ingeniería, 15(20).
Yang, X., Guan, J., Ding, L., You, Z., Lee, V. C. S., Mohd Hasan, M. R., & Cheng, X. (2021). Research and applications of artificial neural network in pavement engineering: A state-of-the-art review. In Journal of Traffic and Transportation Engineering (English Edition) (Vol. 8, Issue 6).
Universidad de Pamplona
I. I. D. T. A.
I. I. D. T. A.