Tecnologías de Avanzada
Aceptado: 15 de febrero de 2023
METHODOLOGY BASED ON MLOPS (MACHINE LEARNING OPERATIONS) FOR MANAGEMENT SUPPORT IN DATA SCIENCE PROJECTS
 Ing. Angela A Ordonez Bolanos *,
PhD. Gustavo Ramirez-Gonzalez*,
PhD. Jorge Gómez Gómez**,
PhD. Juan Sebastian Rojas ***
Ing. Angela A Ordonez Bolanos *,
PhD. Gustavo Ramirez-Gonzalez*,
PhD. Jorge Gómez Gómez**,
PhD. Juan Sebastian Rojas ***
* Universidad del Cauca, Facultad de Ingeniería Electrónica y Telecomunicaciones.
Cauca, Popayán, Colombia.
E-mail: {aaordonezb, gramirez}@unicauca.edu.co
** Universidad de Córdoba, Facultad de Ingeniería. Departamento de Ingeniería de Sistemas y Telecomunicaciones. Montería - Colombia
E-mail: jeliecergomez@correo.unicordoba.edu.co
*** The Bit Bang Company, Popayán, Colombia.
E-mail: sebastian.rojas@thebitbang.company
Esta obra está bajo una licencia internacional Creative Commons Atribución-NoComercial 4.0.

Palabras clave: Machine Learning, MLOps, Machine, Learning Operaciones, Gestión, Metodología, Data science.
Abstract: Many engineering companies have made the strategic decision to venture into the field of data science and MLOps in order to create, extract, and analyze vast amounts of data. This approach holds significant importance due to its inherently multidisciplinary nature, combining principles, concepts, and practices from various domains including engineering, machine learning, and mathematics. The primary objective of exploring this field of work lies in achieving high performance, efficiency, and effectiveness by correctly applying the concepts, methodologies, procedures, and guidelines offered by this area of study. However, it is imperative to acknowledge that despite the clarity of the definition and concept, there remains a dearth of information concerning the specific methodologies and procedures required for executing projects of this nature. This scarcity can be attributed to the relative novelty of the term MLOps. Therefore, this paper presents a comprehensive methodology based on MLOps that serves to facilitate data science project management. It is worth mentioning that while this project is grounded in the context of a Colombian company, extensive research has been conducted, encompassing various countries through the exploration of relevant literature, papers, documents, and information from diverse sources.
Keywords: Machine Learning, MLOps, Machine Learning Operations, Management, Methodology, Data science.
1. INTRODUCTION
Presently, the daily operations of numerous Colombian companies revolve around project-based activities. These projects are undertaken with the purpose of fulfilling customer requirements. Consequently, the execution of a project entails a high level of organizational involvement, prompting the development of techniques specifically designed to enhance the likelihood of project success. Among these techniques is the alignment of diverse groups within the organization, which are established exclusively to support the manufacturing process of the product or service and ensure its smooth deliveryHaving said that, it is crucial to acknowledge that every project needs a preliminary design phase prior to its development and execution. To accomplish this, it becomes imperative to comprehend the nature of the project at hand and ascertain the appropriate guidelines to adhere to for its efficient and successful completion.
In the realm of software development projects, numerous methodologies are commonly employed, such as Scrum, Kanban, and the Dynamic Systems Development Method (Estructuras, Metodologías y Métodos Ágiles y Lean, n.d.). Nevertheless, in the rapidly evolving field of data science, where projects often exhibit diverse approaches and varying development durations, these methodologies alone prove insufficient to address the unique requirements and complexities inherent to projects in this domain. This complexity arises from the multidisciplinary nature of data science, encompassing a diverse range of processes involved in data acquisition and preparation. Only when these data are appropriately processed and comprehended do they transform into meaningful and valuable insights (Gurrola & Rodriguez Rivas, 2020).
While methodologies such as KDD (Knowledge Discovery in Database), SEMMA (Gurrola & Rodriguez Rivas, 2020), CRISP DM and DDS: Data-Driven Scrum (Azevedo & Santos, 2008), exist and are widely utilized for data science project management, a comprehensive and integrated benchmark methodology with a well-defined process for effectively managing and successfully completing data science projects remains elusive. Consequently, many companies in Colombia resort to an empirical approach when developing data science projects, as they lack the strategies necessary to deploy and produce solutions accurately
Hence, the company's data analytics team is tasked with defining all the stages to be followed through experimentation, operating without any established guidelines. They rely on the heuristic "trial and error" method to navigate the process. As a result, when attempting alternative solutions, there is an inherent risk of failure, leading to the need for further iterations and exploration of different options. This renders each project a laborious, time-consuming, and tedious endeavor.
To bridge these gaps, numerous studies have emerged, addressing key research questions and providing valuable guidelines for the advancement of this business practice. These studies propose intriguing recommendations for integrating DevOps and data science practices, thereby enhancing the development of data science projects. Furthermore, there is significant research offering insightful recommendations on machine learning techniques and strategies for maximizing the value derived by companies, taking into account the specific characteristics of the business organization and its primary objectives.
Despite the valuable contributions made by the aforementioned research studies, none of them have explored the utilization of MLOps (Machine Learning Operations). MLOps facilitates effective communication and collaboration between the production team and data scientists, enabling streamlined management of the machine learning production lifecycle, waste reduction, and scalability through automation in data science projects (Saltz, 2021). Therefore, there is a need to investigate the integration of MLOps into data science projects to establish a methodology that supports regulatory compliance, organizational structure, and overall effectiveness within organizations.
This paper presents a MLOps-supported methodology for managing data science projects, providing valuable guidance and direction to the data science team throughout the project lifecycle. The methodology offers a structured set of ordered guidelines, from project initiation to completion, which significantly contribute to the success of data science endeavors. Each step is accompanied by relevant questions, detailed descriptions, and practical recommendations on how to effectively execute the corresponding tasks. The methodology has been validated through its application in a Colombian company. The organization of this paper is as follows: Section 2 illustrates the state of the art, Section 3 presents the proposed methodology, Section 4 outlines the validation of the methodology, and Section 5 concludes with final remarks and insights.
2. STATE OF THE ART
To conduct the state-of-the-art analysis, we adopted the systematic mapping model proposed by Kai Petersen (Petersen et al., 2008). This approach involved exploring four databases, namely Scopus, Web of Science (WoS), ScienceDirect, and Google Scholar, to extract relevant information. Our search yielded approximately 1070 investigations. However, after a proper analysis we focused on extracting the most significant insights from four key papers, which have been instrumental in shaping our understanding of the subject matter.2.1. MLOps: a taxonomy and a methodology (Testi et al., 2022)
In this paper, the authors present a methodology for MLOps (Machine Learning Operations) projects, along with a taxonomy to categorize research works related to MLOps. This document represents a significant advancement compared to the research conducted earlier in 2021, as no proposed methodology specifically addressing this topic was available at that time. It is worth emphasizing that despite the potential of MLOps in enabling faster and more optimal solutions, this field has received limited attention and discussion at the academic level.With this context in mind, the methodology proposed by the authors is structured as follows:
2.1.1. Business Problem Understanding
The methodology begins by establishing a comprehensive understanding of the business context and Key Performance Indicators (KPIs) to define the success criteria and effectively address the identified problem. The authors emphasize that this initial phase is non-technical in nature, underscoring the crucial role of communication between data scientists and business experts.2.1.2. Data Acquisition
The data acquisition phase encompasses several tasks, including:- Data extraction: In this task, the pertinent data for the Machine Learning (ML) model is carefully selected and integrated.
- Data analysis: An Exploratory Data Analysis (EDA) is conducted to identify trends within the dataset, revealing crucial insights.
- Data preparation: This step involves data cleaning, as well as splitting the data into training, validation, and test sets. Additionally, data transformation and feature engineering techniques are applied to prepare the data for modeling purposes.
- Data Augmentation: This technique involves increasing the available data by inserting copies or variations of the existing data.
- Transfer Learning: It is a technique that enables the reuse of a pre-trained neural network that has already been trained on a similar problem.
2.1.3. ML Methodology
Once the data acquisition phase has been successfully completed, the subsequent step involves the selection of the most suitable machine learning (ML) algorithms to address the problem at hand. Typically, the data science team conducts thorough research to explore the state-of-the-art techniques and adopts a bottom-up approach to tackle the specific problem. It is important to note that ML is inherently empirical in nature. Therefore, various features, models, parameters, and hyperparameters configurations are tested and evaluated to identify the optimal combination that yields the best results.2.1.4. ML training and testing
This process follows an iterative approach, wherein the data science team systematically tests different algorithms, functions, and hyperparameters. Once the optimal ML models have been identified, they undergo retraining and subsequent testing. The evaluation of these models involves employing various validation methods, including Holdout validation, Cross-validation, and Bootstrap validation. These techniques provide robust assessments of the models' performance and enable reliable comparisons between different approaches.2.1.5. Continuous integration
This step marks the beginning of the continuous delivery journey. Continuous Integration (CI) empowers companies to enhance software quality and team productivity. This practice encompasses the automated creation and testing of software, ensuring efficient and reliable software development processes.2.1.6. Continuous delivery
This crucial step guarantees that an application is production-ready by successfully passing automated tests and quality checks. The primary objective of the implementation stage is to facilitate a seamless integration of new models, minimizing potential risks. Continuous Deployment (CD) plays a pivotal role in reducing deployment risk through the adoption of practices such as Continuous Integration (CI) and deployment automation. These practices ensure the automated delivery of software into production environments, promoting efficiency and reliability in the deployment process.2.1.7. Continuous Training
In the context of continuous training, it becomes imperative to store and configure additional data in a manner consistent with our model training process. This requirement necessitates outlier detection techniques to identify instances when the data distribution deviates from the training data. Continuous Training (CT) encompasses the automatic retraining and deployment of models, ensuring their ongoing relevance and accuracy. As an integral component of MLOps, CT plays a crucial role by enabling the automatic and continuous retraining of models prior to redeployment.2.1.8. Continuous Monitoring
During this stage, it is crucial to effectively manage the risks associated with models deployed in production by monitoring for performance drift and recognizing any decline in accuracy. Continuous monitoring of the model's predictive performance triggers new iterations in the machine learning process. Once the model is deployed in a production environment, it needs ongoing validation and testing to account for potential shifts and changes in the underlying data patterns. This is essential because the data used during model training may no longer align with the new data encountered in the production environment, leading to a decrease in model accuracy over time.2.1.9. Explainable AI
Deep learning methods exhibit higher model complexity. As these models are integrated into real-world applications in production, the research community has turned its attention towards exploring the concept of "explainability" in order to address business-related inquiries. The authors define explainability as "the extent to which a human can comprehend the reasoning behind a decision." In other words, when an ML system is explainable, it becomes easier to identify and understand the cause-and-effect relationships within the inputs and outputs of the system.2.1.10. Sustainability: Carbon Footprint
The authors raise an important concern regarding the substantial computational and energy requirements associated with the widespread use of Deep Learning models in real-world projects, especially considering its implications for climate change. However, this paper highlights the possibility of mitigating this trend by exploring methods to enhance the energy efficiency of Deep Learning models. Consequently, it becomes crucial for data scientists to be cognizant of their models' carbon and energy footprint, enabling them to actively take measures to reduce it whenever feasible.The significance of the authors' proposed methodology is particularly notable in the context of this project, as it represents the first published methodology addressing this specific domain. This allows for the consideration of other essential factors, thereby facilitating its improvement.
2.2. Machine Learning Operations (MLOps): Overview, Definition, and Architecture (Kreuzberger et al., 2023)
In this paper, the authors adopted a mixed-method approach, comprising three key steps. Firstly, a comprehensive literature review was conducted to explore the topic of MLOps (Machine Learning Operations). Subsequently, relevant tools within the MLOps domain were identified to gain a deeper understanding of the technical components involved. Lastly, the authors conducted interviews with eight experts specialized in MLOps, through which they unveiled four crucial aspects of MLOps: its principles, components, roles, and architecture. The authors further provide detailed information on the number of articles selected based on predefined inclusion and exclusion criteria, the identified tools, as well as the number of conducted interviews. This methodology ensures a comprehensive and well-rounded exploration of the subject matter, allowing for a robust analysis and valuable insights.Besides that, the authors identify nine principles necessary to perform MLOps, and they present the implementation of the principles of the technical components, that is, a guide on how things should be done in MLOps. These principles mentioned are linked to the technical components with which they are associated. In addition to the aforementioned steps, the authors of this paper have identified nine fundamental principles that are essential for the successful implementation of MLOps. These principles serve as a guide for effectively carrying out MLOps activities. By aligning the principles with their associated components, the authors provide a comprehensive framework that outlines the recommended approaches and best practices for executing MLOps. This integration of principles and technical components ensures a cohesive and structured implementation of MLOps, facilitating the smooth operationalization of machine learning models.
The compilation of information presented in this paper bears direct relevance to the execution of our project as it aligns with one of our key objectives established at the project's outset: the development of a comprehensive methodology for effectively managing data science projects using the MLOps approach in organizations.
2.3. Designing an open-source cloud-native MLOps pipeline (Mäkinen, 2021)
This paper explores the architecture of an open-source cloud-native MLOps pipeline. The significance of this pipeline lies in its applicability to a diverse array of machine learning projects. It offers the versatility to be deployed across different environments, including on-premises Kubernetes clusters, multi-cloud vendor Kubernetes environments, and simulated Kubernetes on on-premises machines.Also it considers relevant research questions to carry out the project, like the following:
- What are the requirements of a modern MLOps pipeline?
- How feasible is the design and implementation of a MLOps pipeline using open-source cloud-native tools?
- To what extent can the solution be cloud provider agnostic?
This paper provides crucial insights for our project since one of its sub-stages covers the entire path of the data science project, going from start to finish. Also, the pipeline proposed by the authors meets most of the requirements of MLOps ensuring that the use of such pipeline should increase development performance in CI/CD automation of machine learning projects.
2.4. An intelligent DevOps platform research and design based on machine learning (Battina, 2019)
In this paper, the authors have conducted extensive research on machine learning-based DevOps, providing foundational knowledge that is highly relevant to our own work. They emphasize the benefits of adopting MLOps and outline several reasons why its usage is advantageous, including:- Collaboration
- Automation
- Rapid innovation
- Quick and easy implementation
- Effective lifecycle management
However, automating DevOps yields several positive outcomes, including improved model quality, waste reduction, early adaptation, and a swift feedback loop, among others. The authors strongly recommend the implementation of MLOps, as it significantly enhances operational efficiency and production for companies.
3. PROPOSAL
This section presents the MLOps-supported methodology for managing data science projects, providing valuable guidance and direction to the data science team throughout the project lifecycle. Its different phases are illustrated in Figure 1 and are explained as follows.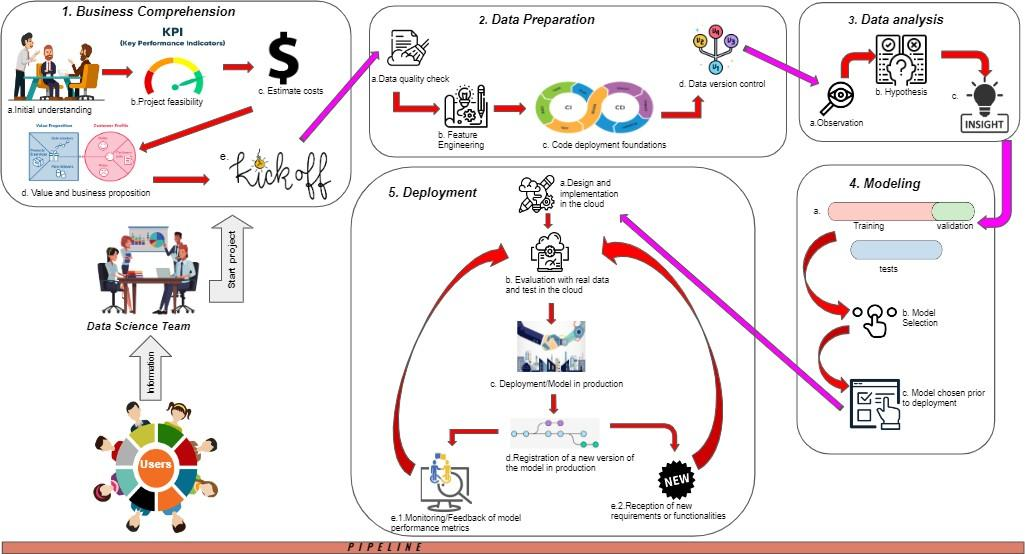
3.1. First stage: Business Comprehension
This stage includes 6 subphases that will be explained as follows:3.1.1. Initial understanding
In this subphase, the problem at hand is initially assessed through an initial client meeting. The primary objective of this stage is to gather essential information from the client, enabling the project team to comprehend the requested requirements and expected outcomes. To achieve this, it is crucial to obtain answers to a series of targeted questions, which serve as a guide for comprehensive understanding and clarity and are stated as follows:- Is the problem at hand specific to a client or does it pertain to the company internally?
- Are there any requirements for implementing the ML model on cloud services?
- What is the specific problem that needs to be addressed?
- How does this problem impact the company?
- What data is currently accessible to tackle this problem?
- Are there any external datasets that might be pertinent to solving the problem? If so, what are they?
- What are the expected outcomes or results? Will the final deliverable be an ML model, an analytical report, or a dashboard?
3.1.2. Project feasibility
This substage encompasses both technical and commercial success criteria, which should be quantifiable. To achieve this, it is essential to define key performance indicators (KPIs). KPIs serve as metrics that gauge the progress and performance of the ongoing project. Typically expressed as percentages, KPIs enable us to assess the current state of a business within a specific domain and subsequently optimize strategies based on the findings (Battina, 2019).3.1.3. Estimate costs
In this step the client is provided with a comprehensive cost estimation for the project, taking into account all the previously specified requirements. This includes considerations such as taxes, acquisition costs, storage and data processing expenses, human resources, and other factors that impact the final pricing of the product.3.1.4. Value and business proposition
Within this substage, a fundamental question arises: What are the benefits for customers in utilizing our software or service?The ML system should strive to deliver value to end-users. Similarly, the ongoing project should possess a value proposition that entices and motivates clients to engage with the services or make purchases from the company. Furthermore, the business proposal entails presenting the project's cost to the client, aligning it with the previously agreed-upon specifications.
3.1.5. Kickoff
This consists of a presentation that includes the following points:- Project Objective: Clearly define the objective of the project.
- Phases: Outline the different phases that will be undertaken to achieve the project's goal.
- Deliverables and Proposed Solution: Specify the deliverables that will be provided to the client and present the proposed solution to address their needs.
- Deployment Architecture: Describe the architecture that will be used for deploying the solution.
- Data Analysis: Outline the methodology and techniques that will be employed for data analysis.
- ML Model (Product or Service in the Cloud): Detail the machine learning model to be developed and specify if it will be a product or service hosted in the cloud.
- Work Team: Introduce the members of the project team along with their roles and responsibilities.
- Communication Channels: Define the channels and platforms that will be used for effective communication and collaboration.
- Follow-up Meetings and Consultancy: Establish a plan for follow-up meetings and ongoing consultancy to ensure the project progresses smoothly.
3.2. Second stage: Data Preparation
Data preparation consists of the following steps:- Data quality check
- Feature engineering
- Code deployment foundations
- Data version control
3.2.1. Data quality check
Within this step, the integrity of the data provided by the client to the company is examined. The objective is to ascertain whether the data adheres to the defined business rules. Both recent and historical data provided by the client must be suitable for the project's requirements. This entails verifying the presence of out-of-range data, empty fields, data imbalances, and other related factors. It is important to highlight that if the client fails to provide usable data, the data preparation process cannot proceed.Once the data validity has been verified, the next step involves examining the consistency of the data. This process utilizes Python-based tools. The primary activities within this stage include identifying duplicate instances and ensuring a standardized data representation throughout the data structure. The delivered inputs should adhere to the required format; however, if inconsistencies arise, the data must be transformed into a consistent format to enable efficient access and management of information. Furthermore, data consistency is crucial as it ensures that the data accurately reflects reality and maintains precision and uniformity. To achieve this, all previous processes are conducted to examine the integrity of the data. The objective is to verify data quality and minimize data loss by ensuring the cleanliness of the dataset. It is important to note that the integrity of the data can be compromised by issues in the data capture process or from the data source itself. Therefore, utmost care must be taken at each stage of the data preparation process to maintain data integrity.
3.2.2. Feature engineering
Feature engineering is an integral process in building predictive models using machine learning. It involves the selection and transformation of variables to enhance model performance. The process of feature engineering typically encompasses three main activities: feature creation, transformation, and extraction (CI/CD para Machine learning – Canalizaciones de Amazon SageMaker – Amazon Web Services, n.d.)- Feature creation involves generating new features based on existing ones. The primary objective is often to reduce the dimensionality of the feature space.
- Feature transformation handles the replacement of missing or invalid features in the dataset.
- Feature extraction aims to identify the subset of features that are most relevant to the specific problem being addressed.
3.2.3. Code deployment foundations
This substage focuses on the application of DevOps best practices to MLOps activities. However, it is crucial to address any gaps in traditional DevOps practices before delving into more complex tasks such as data and model versioning, continuous model training, or feature storage. During this step, the following questions are addressed:- How is the code maintained?
- What source code version control system is utilized?
- How is system performance monitored?
- In terms of deployment and test automation: What is the CI/CD pipeline for the code base? - Which tools are employed for this purpose? Some examples of such tools include Jenkins, AWS, Azure, DevOps, and GitLab.
3.2.4. Data version control
Is a mechanism utilized to manage and track changes made to software code. It enables the control and tracking of the specific version of the dataset used for training a particular model. In this step, it is crucial to address the following questions:- Is data version control optional or mandatory?
- What data sources are available? (e.g., proprietary, public, paid data)
- What is the storage solution employed for the aforementioned data?
3.3. Third stage: Data Analysis
Data analysis consists of the following 3 steps:- Observation
- Hypothesis (Applicability of machine learning)
- Insights
3.3.1. Observation
It is the process through which specific patterns in the available data are identified. These patterns are statistically observed and can be represented in various forms such as tables, histograms, graphs, and more. The objective of this substage is to comprehend the data's trends and ensure accurate interpretation and analysis.3.3.2. Hypothesis
Subsequently, various hypotheses are proposed to determine the usefulness of the variables in the study for making accurate projections. In the case of implementing a Machine Learning model, it is essential to verify the applicability of ML. To gain insights, the following questions can be addressed:- Which programming language should be utilized for the analysis? (R, Python, Scala, Julia, SQL?)
- Are there any infrastructure requirements for model training? For instance, storage capacity, profitability, security, and computer performance (resources).
- What ML-specific and business assessment metrics (KPIs) need to be calculated? (Machine Learning Lens - Machine Learning Lens, n.d.)
- Reproducibility: To ensure reproducibility, it is necessary to capture the computing environment in which the work was conducted, enabling others to replicate it. This raises the following questions:
- Are any tools being employed to create a reproducible environment? For example, conda, pip-toold, among others (Quintanilla, Luis, 2023).
- What metadata about ML experiments is being collected? (e.g., datasets, hyperparameters).
3.3.3. Insights
After collecting all the available data, the next step involves examining the information to determine its value and relevance. This analysis, usually known as Exploratory Data Analysis (EDA), enables informed decisions regarding which data will be used to prepare the algorithm and evaluate it, ultimately leading to the extraction of valuable business insights.- Step-by-step exploratory analysis for structured data: The first step involves formulating a question that aligns with the project's objectives. Then, the dataset should be examined, paying attention to its size to determine the characteristics or variables (i.e., columns) present. Additionally, a preliminary scan of the recorded data in the tables should be conducted to gain an initial understanding. This process provides an initial idea of the data at hand. It is important to determine the variable types, distinguishing between numerical and categorical data. Categorical data can further be classified as nominal, binary, or ordinal based on their nature. The statistical description of data depends on the type of variables being analyzed, and two types of measurements are commonly used: central tendency and variability.
Outliers should be given careful consideration as they play a significant role in exploratory data analysis. However, when working with categorical data, bar charts can effectively visualize the count or percentage of occurrences within each category. In addition, we can consider a possible schema for prediction. When dealing with an imbalanced dataset, using a conventional classifier may pose training difficulties. Thus far, we have conducted analysis and visualization on a single variable, referred to as univariate analysis. However, we can also explore interactions and potential relationships between two or more variables, known as bivariate and multivariate analysis. This allows us to examine linear trends, where an increase in one variable corresponds to an increase or decrease in another. We can calculate the correlation index between these variables, where a value close to 1 indicates a positive linear relationship, a value close to -1 indicates a negative linear relationship, and a value close to 0 indicates no linear correlation.
Furthermore, we can compare a numeric variable with a categorical variable and utilize bar graphs or fiddle plots. A fiddle plot, similar to a boxplot, displays the median, quartiles, and a density plot illustrating the distribution. Comparisons between two categorical variables can be made using stacked bar charts. In multivariate analysis, we simultaneously compare all possible pairs of variables to identify relationships. We calculate correlation indices between different pairs of variables and present the results in a correlation matrix. The main diagonal of this matrix contains values of 1 since we are comparing a variable with itself, while the off-diagonal values represent the analyzed relationships.
The final step of the EDA is the summary, where we draw important conclusions from all the conducted analyses. This allows us to identify correlated variables or characteristics and determine their relevance.
3.4. Fourth stage: Modeling
The modeling consists of the following stages:- Training, validation and tests
- Selection of models
- Model chosen prior to deployment
3.4.1. Training, validation and tests
This process takes the processed dataset as input and produces three outputs: the training dataset, the validation dataset, and the test dataset. When working with a dataset, it is divided into three sets: the training set, the validation set, and the test set. The training set is typically the largest, comprising around 60% to 80% of the input data. It is crucial to gather sufficient training data to gain insights and establish model parameters for optimizing the training process.In this context, it is important to note that configurations that control the behavior of the machine learning algorithm and the resulting model architecture are referred to as hyperparameters. The number and type of hyperparameters vary depending on the specific machine learning model. Common examples of hyperparameters include the learning rate, number of hidden layers, number of hidden units, and choice of activation functions. Hyperparameter tuning or optimization involves selecting the optimal model architecture by adjusting these hyperparameters.
Now, a portion of the dataset is allocated for validation, which helps test and validate the hyperparameters instead of adjusting them as done during training. Subsequently, the remaining part of the dataset is designated as the test dataset, which is used to evaluate the generalization ability of the machine learning model. This evaluation aims to assess the model's effectiveness in making predictions when confronted with new and previously unseen data. It is a crucial step as it validates the performance and accuracy of the model. Multiple models can be generated using different methods, and each model can be evaluated accordingly. In general, various metrics are calculated within a machine learning algorithm, including training errors, overfitting, and prediction accuracy, among others. These metrics serve to determine if the model learns effectively and generalizes well in making predictions on unknown data. The specific metrics reported by the algorithm depend on the nature of the business problem and the machine learning technique employed. For instance, a classification algorithm may be assessed using a confusion matrix that reveals true or false positives and true or false negatives, while a regression algorithm can be evaluated using the root mean square deviation (RMSE).
3.4.2. Selection of models
After performing data cleaning, preparation, and understanding, the next stage involves the selection of one or multiple models that demonstrate good performance with the data. This substage is commonly referred to as model selection. However, it is crucial to acknowledge that there are various criteria for conducting this selection accurately. Among the most commonly used criteria are the Akaike information criterion (AIC) and the Bayes factor, as well as the Bayesian information criterion (BIC), which provides a reasonable approximation of the Bayes factor. (10 sugerencias principales para Machine Learning reproducible, n.d.)In order to select appropriate models, it is essential to address the following questions:
- Which Machine Learning algorithm should be employed? The choice of algorithm primarily depends on two key aspects of the data science scenario:
- What is the objective of the analysis? In other words, what problem needs to be addressed by leveraging historical data?
- What are the specific requirements of the data science scenario? This includes considerations such as linearity, accuracy, training time, and the number of parameters involved (hmong.wiki, n.d.).
3.4.3. Model chosen prior to deployment
In this substage, the chosen model is prepared for deployment. It is crucial for this model to fulfill all the requirements specified by the client and successfully pass through each stage of the process. Moreover, during the preceding substage, "Model Selection," among various available models, the chosen model aligns most closely with the client's needs, making it feasible and beneficial for deployment.3.5. Fifth stage: Deployment
3.5.1. Design and implementation of the solution in the cloud
This substage holds significant importance as it involves making critical decisions regarding the architecture of the model. It is here that the optimal utilization of the predictive model is determined. In prediction systems relying on Machine Learning algorithms, several questions arise, such as: How will this prediction be utilized? Who are the intended clients of the system? How should the client receive the information? These questions revolve around how the model will be consumed and how its efficiency can be maximized. For instance, considerations may include whether the client will receive a prediction report in an Excel document or have access to it through a web page. In the case of classification, should the classification occur daily or weekly? Generating relevant questions is crucial to understanding and fulfilling customer requirements. It is important to note that the solution design step is typically carried out during this final stage. However, it is possible that in certain cases, it may be initiated during the initial stage of understanding the business. The timing depends on the project management approach employed. Often, nothing is designed and implemented in the cloud until there is certainty that a model fulfilling the required task and meeting the client's needs exists. This precautionary approach ensures that the model performs as expected and can address the client's requirements. Factors such as insufficient data or poor data quality may affect the model's effectiveness, leading the client to make decisions regarding cloud deployment. Consequently, this step is positioned within this final stage, allowing for informed choices to be made based on the model's performance and suitability.3.5.2. Evaluation with real data and tests in the cloud
In this step, the most suitable model has been selected and is subjected to testing in the cloud using real data. The purpose is to determine whether the model's performance and accuracy align with the business objectives. Various approaches can be employed for evaluation and cloud-based testing, with the gitflow workflow being one of the well-known methodologies. Additionally, there exists a range of tools to facilitate this process, allowing for controlled deployment of different model versions in the cloud environment without causing any disruption to users. Once thorough testing is conducted and it is ensured that a stable and efficient model version exists, the model is then deployed for production use.3.5.3. Deployment/Model in Production
Deploying an ML model involves transitioning it from the development stage to the production stage, enabling its availability to end users. This aspect has gained significant importance in recent years, particularly in the industrial application development domain. MLOps encompasses a set of practices aimed at achieving reliable and efficient deployment and maintenance of ML models. Deployment plays a central role in this process, as it involves making the trained model accessible to end users.The choice of deployment type depends on the model's use case and various design requirements, including:
- Type of Prediction: This can be either real-time or in batches.
- Real-time predictions involve quickly generating and returning predictions to the user upon receiving a request.
- Batch predictions, on the other hand, focus on processing large amounts of input data, with predictions generated asynchronously, not immediately.
- Latency: The response time required from the moment a request is sent to the model in production until the prediction is received. The goal is to minimize this time as much as possible.
- Throughput: The number of requests per second that the system hosting the model can handle.
- Model Complexity: This refers to the size of the machine learning model, indicating the computing and storage resources it requires. More complex models demand greater computational resources.
However, it is important to consider the available deployment alternatives, which can generally be divided into two main categories:
- Cloud Deployment: This involves performing the necessary computations for predictions on remote servers hosted in the cloud. In this approach, data and predictions are transferred over the internet. It is recommended to use this alternative when dealing with complex models or when latency is not a critical factor, as it allows for potential delays in data transmission and prediction retrieval. Additionally, cloud deployment is suitable for batch predictions. When deploying in the cloud, there are two ways to access the model:
- The first approach involves storing input data in a database and programming the system to periodically retrieve that data and generate predictions. The resulting predictions are stored in another database and are periodically delivered to a client application responsible for delivering them to the end user.
- The second approach is to package the model into an API (Application Programming Interface) that can receive requests from end users and deliver prediction results. This method is employed when low-latency predictions are required and when batch processing is not necessary.
- On the Edge: This deployment approach involves hosting the model directly on the device responsible for receiving the requests, such as a mobile phone, tablet, or smartwatch. However, these devices typically have limited computing capacity. On the edge deployment is suitable for scenarios where the models are not highly complex, low latency is required, or sending information over the internet is not desirable due to security concerns. It is worth noting that in this deployment mode, real-time predictions are possible, as mobile devices have limited resources for batch processing.
3.5.4. Registering a new version of the model in production (Model Registration and Model Versioning)
Machine learning models often require updating due to "model decay," where their performance decreases over time as new data becomes available. To ensure compatibility with previous versions, it is essential to maintain a record of the previously created models. By implementing model versioning, multiple versions of the machine learning model can be tracked, enabling the adoption of different deployment strategies.Model versioning allows for the tracking of modeling history and associated scores from model run results as new or different datasets are provided. This enables a comprehensive understanding of model performance and facilitates iterative improvements over time.
3.5.5. Monitoring / Feedback of model performance metrics / Reception of new requirements or functionalities
Once the deployment stage is reached, a continuous monitoring process begins to ensure the model's performance metrics are functioning correctly. This monitoring process relies on feedback from the client regarding the machine learning system's performance in the specific task at hand. Additionally, the consideration of incorporating new functionalities into the system is an important aspect of this substage, requiring feedback on any proposed changes or retraining.To monitor the performance of the machine learning model effectively, the following questions have been formulated:
- What is the serving model?
- How are the predictions delivered?
- What level of management is desired? (Batch or online)
- What is the expected time for changes? (Time from commit to production)
- What type of environment will consume the model outputs (predictions or classifications)?
- What are the performance metrics of the model?
- What is your model release policy? Does it require A/B testing or multi-armed bandits testing to measure effectiveness on business metrics and determine which model should be promoted in the production environment?
- What is your implementation strategy applied to machine learning? (e.g., shadow/canary deployment required?)
- Batch Inference: This process is suitable when latency is higher and real-time predictions are not necessary for the AI model. It is an asynchronous process that does not depend on user traffic, and any failures do not require immediate action as there are no affected clients.
- Online Inference: Online inference is required when synchronous predictions are needed. The model must be decoupled from mobile and web applications. This decoupling allows data scientists to update the model, roll back to previous versions, and implement various deployment strategies more easily.
- Inference and Feature Store (online): SageMaker Feature Store provides low latency (less than 10 milliseconds) and high read throughput to serve the model on top of newly arriving data.
- Edge Inference: Edge inference is beneficial in cases where connectivity is limited. It leverages IoT devices or mobile devices, offering scalability by deploying the model on different devices. However, this approach presents new risks and challenges. Developing models capable of running on devices with limited capacity compared to cloud clusters requires careful consideration of the model's architecture and the implementation of robust processes to reap the benefits.
- Latency: How quickly do applications/users require the model prediction results?
- Data privacy: Are there concerns about sending data to a back-end system?
- Network connectivity: Certain deployment options rely on internet or network access. Limited or no network connectivity in the deployment environment narrows down the available options.
- Cost: Different deployment options vary in cost. Consider the expenses associated with keeping a server online 24/7 to serve predictions and the operational and maintenance costs involved.
4. VALIDATION CHECKLIST
To validate the methodology, a questionnaire was created using the Google Forms tool. This questionnaire underwent validation with the participation of seven different projects involving four engineers and an intern from the Faculty of Electronics Engineering and Telecommunications at Universidad Del Cauca. The questionnaire includes a series of questions based on the five stages of the methodology. The following are the most pertinent questions from each stage:4.1. Stage 1: Business Comprehension
The following questions are relevant for this stage:- Is there access to a suitable dataset to address this problem?
- Have the requirements or needs of the client/company and the project objective been fully understood?
- Is there a requirement for the ML model or dashboard to be implemented in cloud services? If not, please provide an explanation.
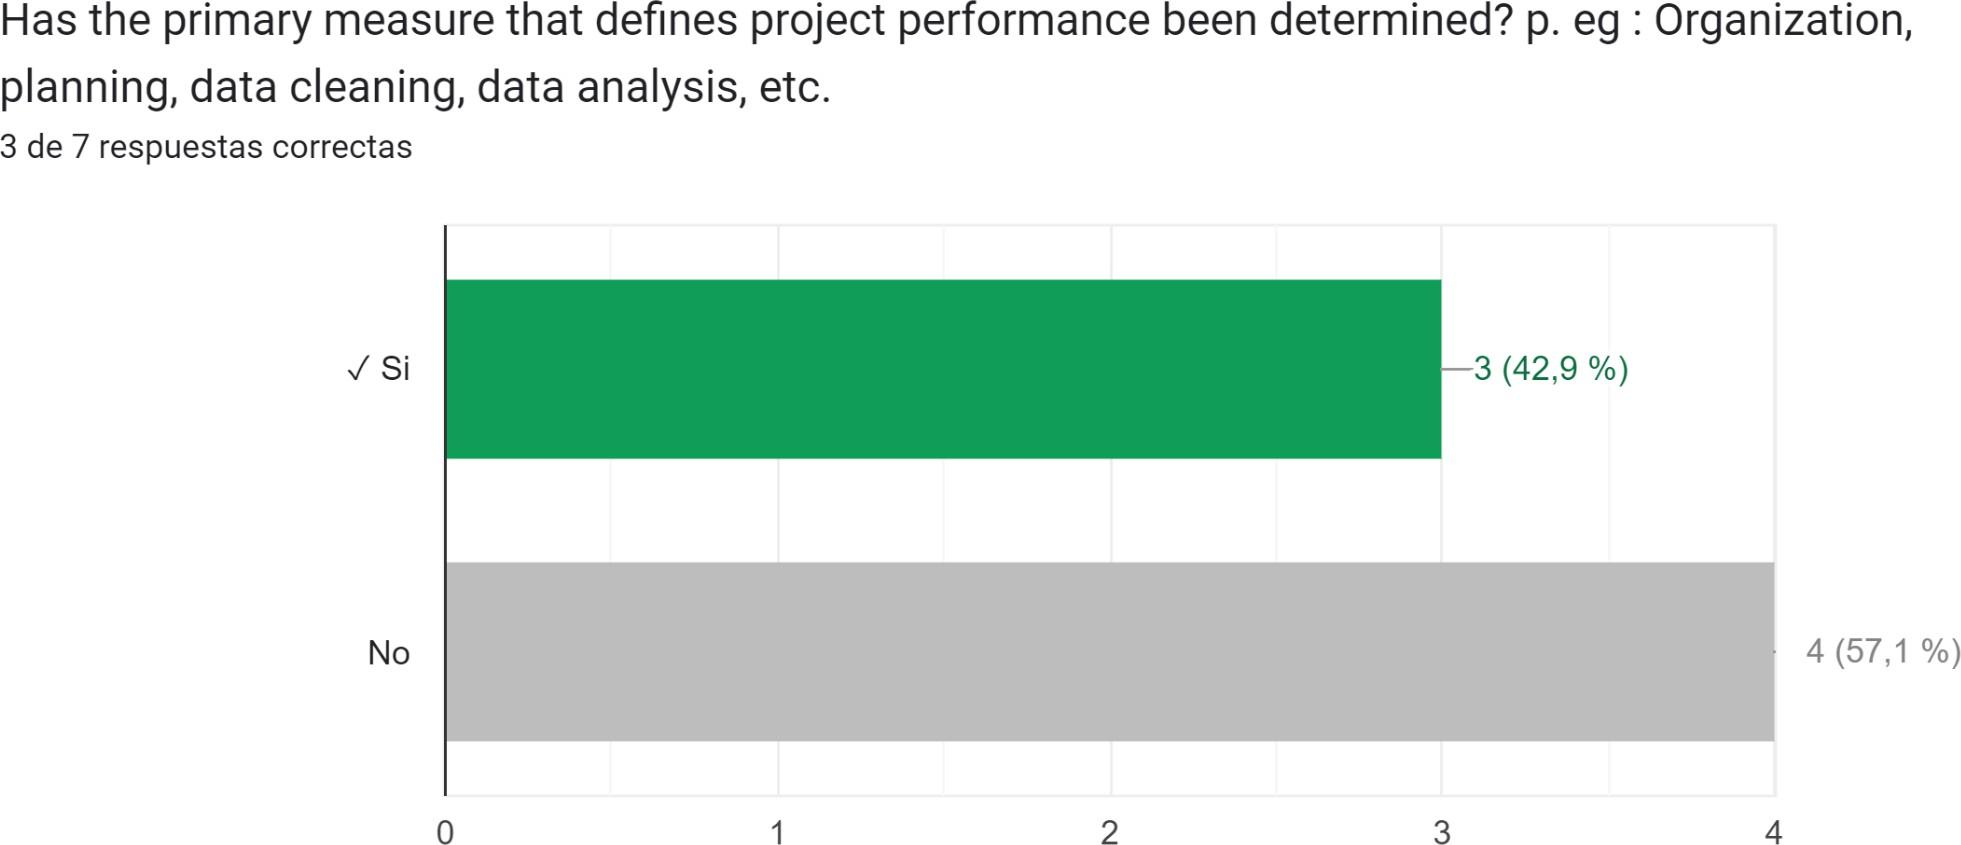
- Have the technical and business success criteria for the project been identified?
- Have the necessary physical components for the project's development been calculated and determined?
- Is there a plan in place for data storage and processing?
- Have the required human resources been allocated?
- Are cloud tools being considered? Specifically, are AWS tools being utilized?
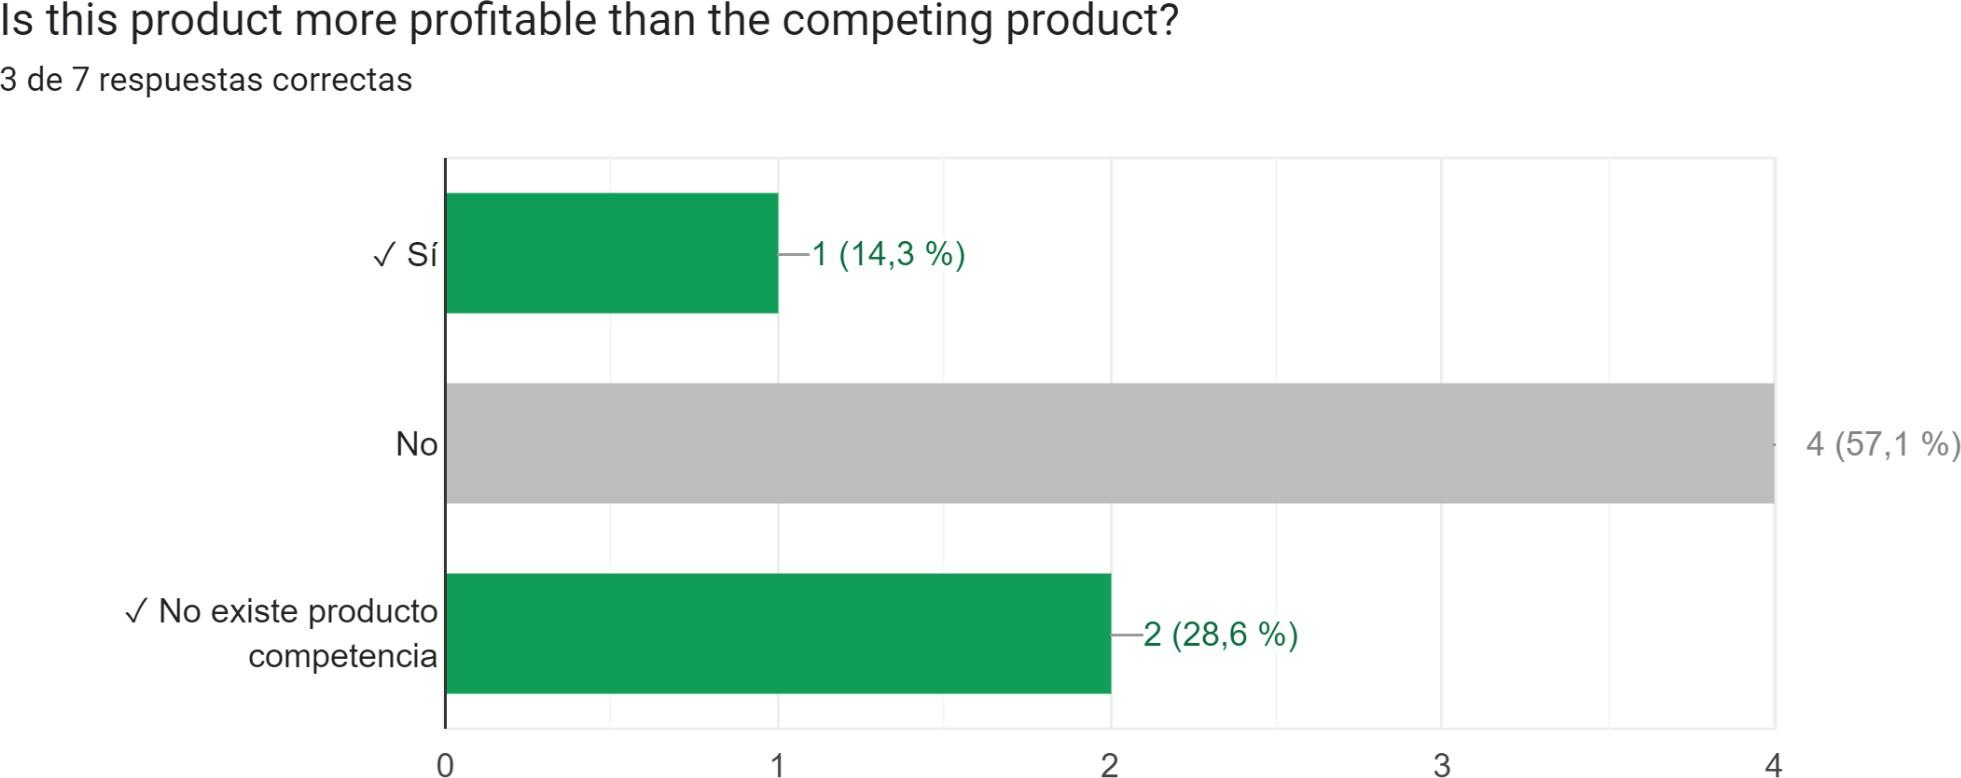
- Has it been established whether this business is financially viable for potential consumers of the product or service being offered?
- Has the design of a project pipeline been initiated?
4.2. Stage 2: Data Preparation
The following questions are relevant for this stage:- Has an analysis been conducted to determine if the data provided by the client is suitable and useful for the project? If not, has the necessary data treatment been performed?
- Have the relevant features in the dataset been extracted to address the problem?
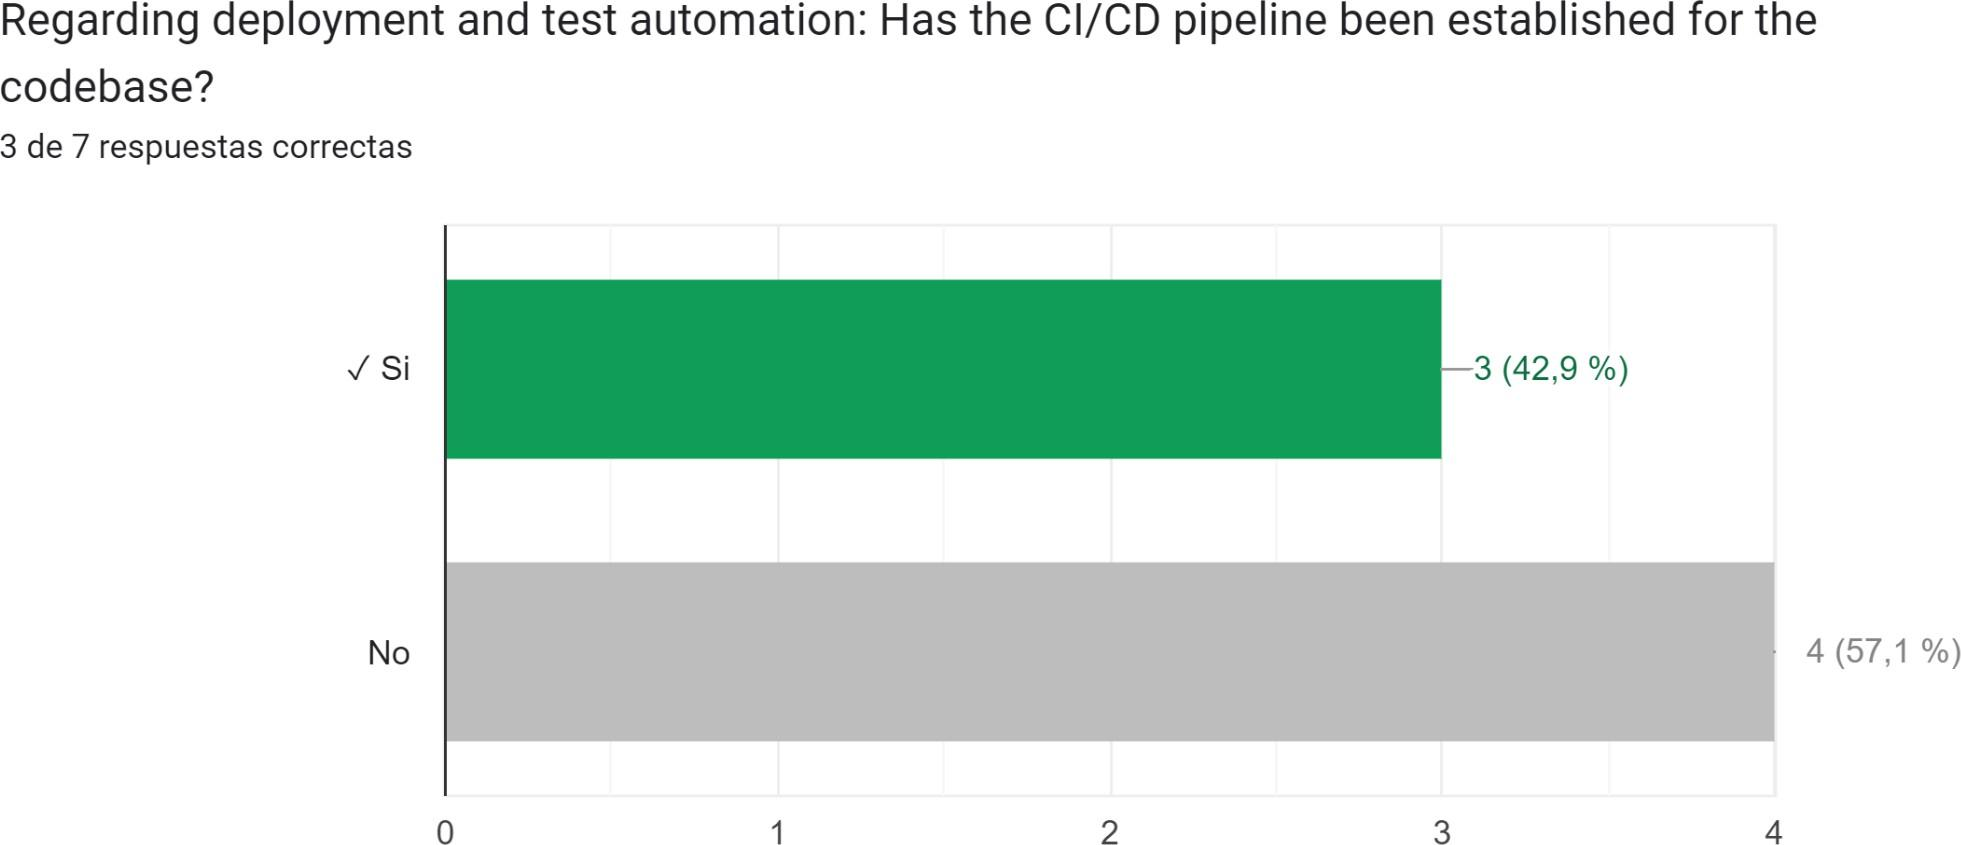
- Regarding deployment and test automation, has the CI/CD pipeline been established for the code base?
4.3. Stage 3: Data Analysis
The following questions are relevant for this stage:- Was a statistical description of the data carried out?
- Was the necessary analysis conducted to identify if the data exhibits any patterns or clusters?
- Was the analysis of percentiles (e.g., 75th, 25th, min, and max) performed?
- Do you believe that the appropriate analysis was conducted to draw the most important conclusions?
- Have the necessary hypotheses been formulated to assess the usefulness of the variables in the study for making projections?
- Has the algorithm been evaluated?
4.4. Stage 4: Modeling
During this stage, the following considerations are important:- Has a suitable machine learning algorithm been selected to address the problem?
- Has the model been trained?
- Depending on the business problem and the machine learning technique used, select the option that best describes your machine learning model: binary, classification, multiclass classification, regression, clustering, classification, or anomaly detection.
- Has the model been appropriately evaluated?
- Have measures been taken to prevent overfitting?
- Have the necessary tests been conducted to ensure the correct functioning of the model?
4.5. Stage 5: Deployment
The following aspects are relevant for this stage:- Was the model chosen for the development and execution of the project?
- Describe the evaluation process and the tools used, or explain why it was not necessary to perform this process.
- Is the model currently in production? This means that the model is deployed in the cloud, fulfilling the required functions, and is accessible to the client.
- Is the model reproducible? Reproducibility is crucial for machine learning projects. It is important to provide details on the method and results of the modeling phase so that it can be reproduced.
- Please specify your implementation strategy and explain the reasons behind its selection.
- Real-world data may differ from the data used to train the model, potentially leading to reduced model quality. Are mechanisms in place to monitor the model and prevent a decline in its performance?
- For a dashboard, the maximum number of points is 55.
- For an analytical report, the maximum number of points is 76.
- For a machine learning model, the maximum number of points is 115-122, depending on the chosen evaluation metric.
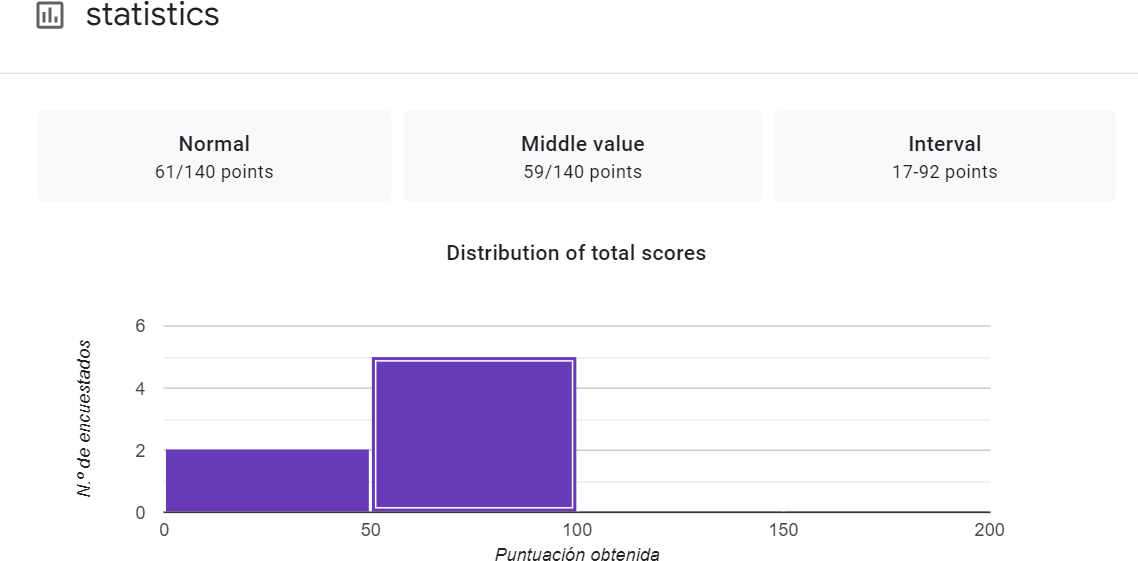
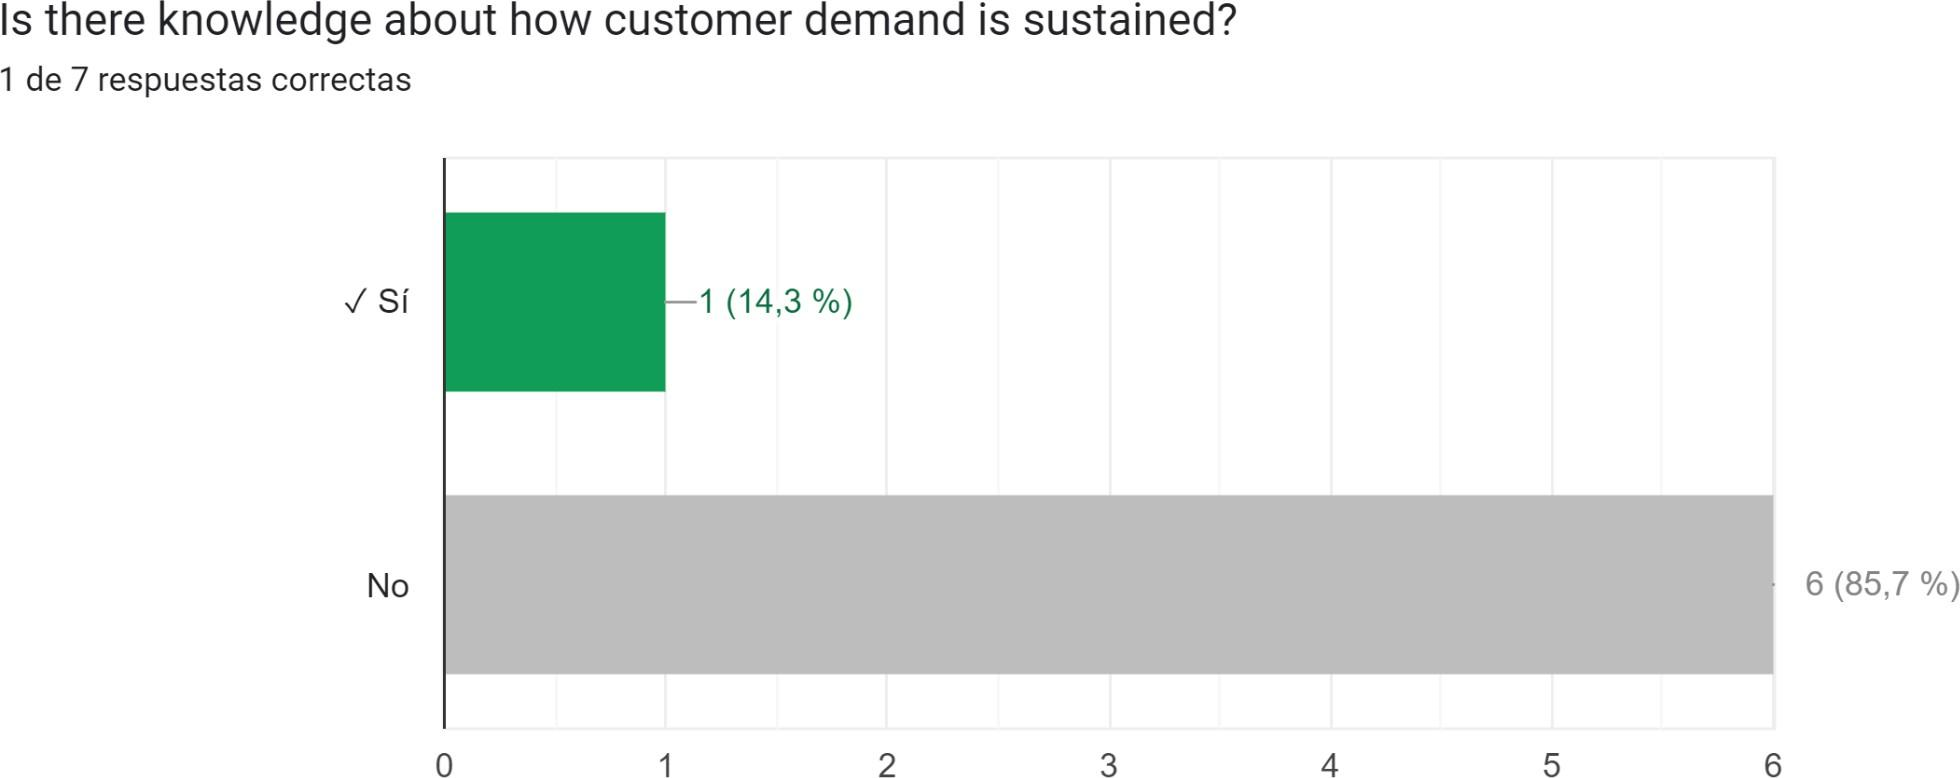
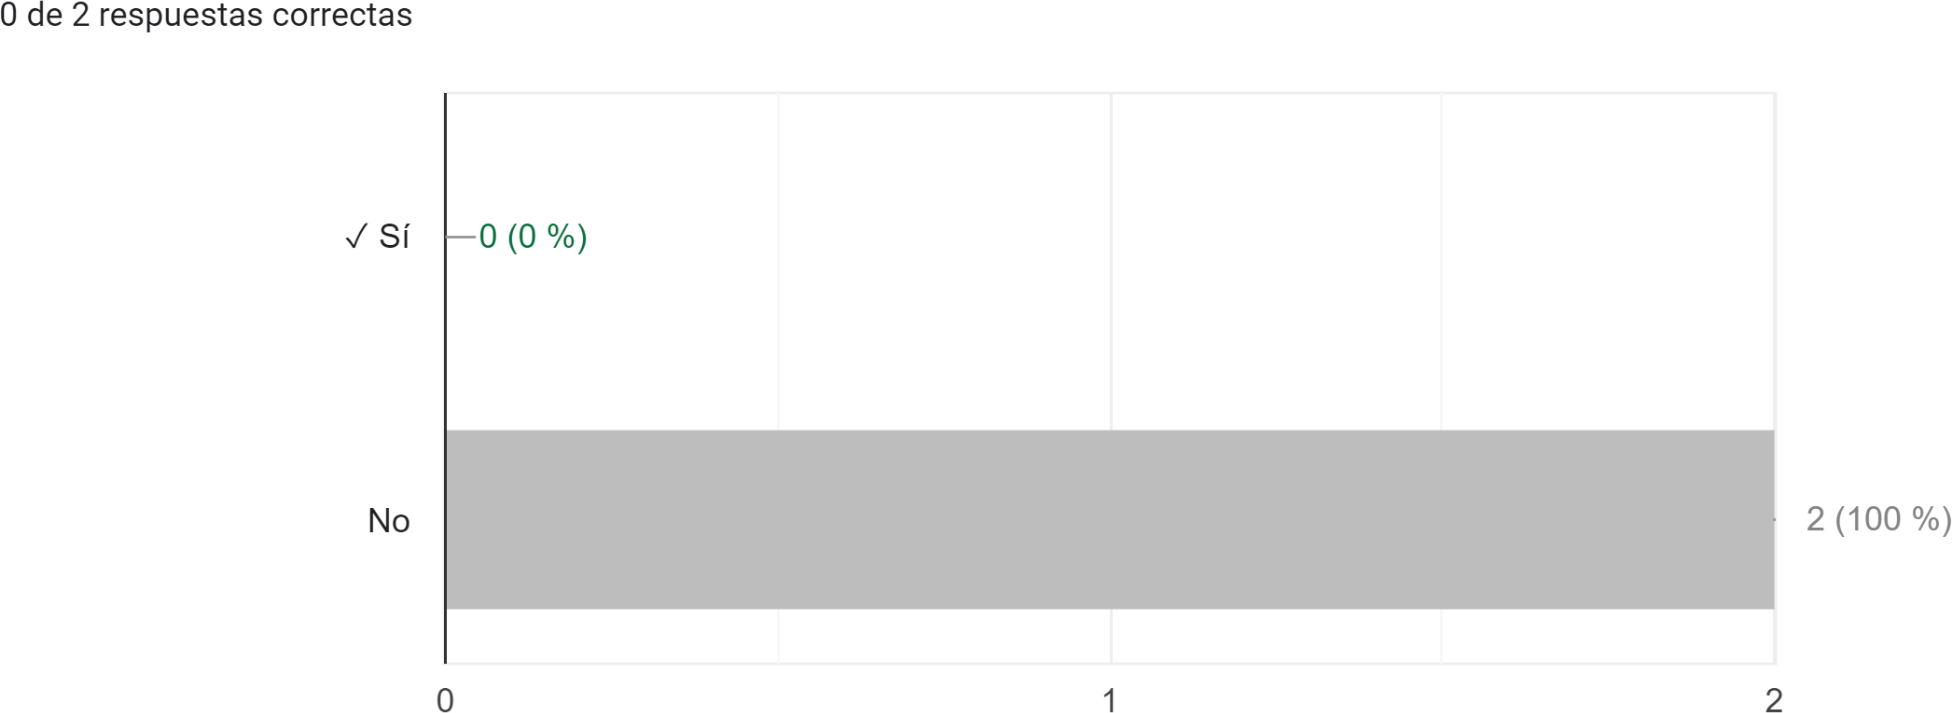
An analysis of the questionnaire responses has been conducted, revealing several noteworthy indicators that deserve careful consideration. It is evident from the analysis that the majority of projects either fail to comply with these indicators or overlook their significance. Figures 4, 5, 6, 7, and 8 highlight the specific questions where respondents who completed the questionnaire display the highest rates of non-compliance.
5. CONCLUSIONS
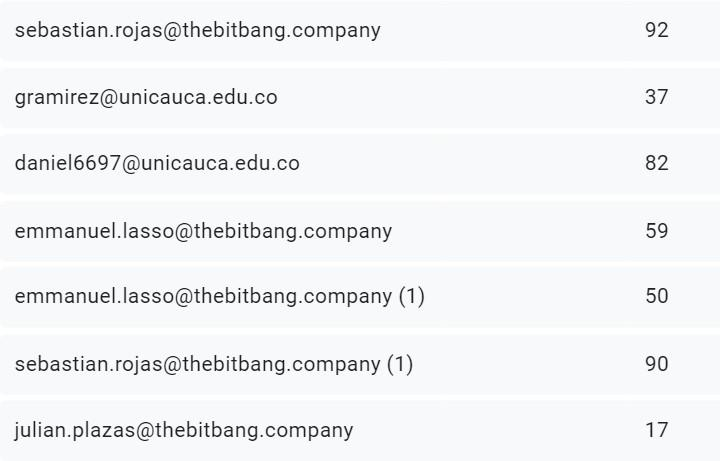
This paper presents a methodology based on MLOps aimed at supporting management in data science projects. To validate the effectiveness of this methodology, a questionnaire was developed using the Google Forms tool. The questionnaire was administered to seven different projects, involving four engineers and an intern from the Faculty of Electronic Engineering and Telecommunications of the Universidad Del Cauca. The intern's project was carried out concurrently with the development of this methodology, as both projects focused on the implementation and application of MLOps. While the project titled "PROPOSAL FOR THE IMPLEMENTATION OF A MLOPS FOLLOWING THE GUIDELINES DEFINED BY THE COMPANY WIZIT MIND BLOWING SOLUTIONS SAS" aimed to align with the proposed methodology to a significant extent (approximately 90%), not all aspects of the methodology were applicable to this specific project. It is important to note that the remaining six projects were in their final stages. The questionnaire serves two primary objectives:Firstly, it evaluates the progress of each project. To facilitate this evaluation, an Excel document was created. The status of a project can be determined based on the number of points obtained, using the validation list provided in the survey. The scoring system is as follows:
- For yes/no questions, one point is awarded for a "yes" response and zero points for a "no" response.
- Multiple-choice questions are scored by assigning one point for each selected option. For example, if a multiple-choice question offers seven options and the user selects all of them, they will be awarded seven points. However, it should be noted that the scoring for multiple-choice questions must be manually calculated, as Google Forms does not provide automatic individual point summation for questions with multiple correct answers.
The second objective of the questionnaire is to enable the engineering team to identify any missing steps in the project's development. This involves analyzing whether certain features or metrics have been overlooked and identifying relevant areas that may have been overlooked but are crucial to the project's success.
It is crucial to emphasize that the questionnaire should be answered by the data science team members who serve as leaders, in collaboration with their respective technical and business teams. Since the questionnaire encompasses both technical and business domains, input from the entire team is essential to address it comprehensively. Each team member plays a distinct role with unique responsibilities, and therefore, answering the questionnaire with the appropriate individuals is crucial to ensure that no steps in the methodology are overlooked and to provide informed responses.
An analysis of the responses obtained through Google Forms indicates that the projects align with 70% to 80% of the methodology. However, the most challenging areas for the company to comply with are deployment, as well as the financial and competitive aspects.
REFERENCES
10 sugerencias principales para Machine Learning reproducible. (n.d.). Platzi. Retrieved June 26, 2023, from https://platzi.com/blog/diez-sugerencias-para-machine-learning/Azevedo, A., & Santos, M. (2008). KDD, SEMMA and CRISP-DM: A parallel overview. IADIS European Conf. Data Mining. https://www.semanticscholar.org/paper/KDD%2C-SEMMA-and-CRISP-DM%3A-a-parallel-overview-Azevedo-Santos/6bc30ac3f23d43ffc2254b0be24ec4217cf8c845
Battina, D. S. (2019). An Intelligent Devops Platform Research And Design Based On Machine Learning. Training, 6(3).
CI/CD para Machine learning – Canalizaciones de Amazon SageMaker – Amazon Web Services. (n.d.). Amazon Web Services, Inc. Retrieved June 26, 2023, from https://aws.amazon.com/es/sagemaker/pipelines/
Estructuras, Metodologías y Métodos Ágiles y Lean. (n.d.). Retrieved June 26, 2023, from https://www.centro-virtual.com/recursos/biblioteca/pdf/metodologias_agiles/clase2_pdf1.pdf
Gurrola, R., & Rodriguez Rivas, J. G. (2020). Ciencia de los Datos, Propuestas y casos de uso.
hmong.wiki. (n.d.). Selección de modelo IntroducciónyDos direcciones de selección de modelo. Retrieved June 26, 2023, from https://hmong.es/wiki/Model_selection
Kreuzberger, D., Kühl, N., & Hirschl, S. (2023). Machine Learning Operations (MLOps): Overview, Definition, and Architecture. IEEE Access, 11, 31866–31879. https://doi.org/10.1109/ACCESS.2023.3262138
Quintanilla, Luis. (2023, March 13). Métricas de ML.NET - ML.NET. https://learn.microsoft.com/es-es/dotnet/machine-learning/resources/metrics
Machine Learning Lens—Machine Learning Lens. (n.d.). Retrieved June 26, 2023, from https://docs.aws.amazon.com/wellarchitected/latest/machine-learning-lens/machine-learning-lens.html
Mäkinen, S. (n.d.). Designing an open-source cloud-native MLOps pipeline [University of Helsinki]. Retrieved June 26, 2023, from https://helda.helsinki.fi/bitstream/handle/10138/328526/Makinen_Sasu_Thesis_2021.pdf?sequence=2&isAllowed=y
Petersen, K., Feldt, R., Mujtaba, S., & Mattsson, M. (2008). Systematic Mapping Studies in Software Engineering. Proceedings of the 12th International Conference on Evaluation and Assessment in Software Engineering, 68–77. http://dl.acm.org/citation.cfm?id=2227115.2227123
Saltz, J. (2021, July 30). Data Science Management: 5 Key Concepts. Data Science Process Alliance. https://www.datascience-pm.com/data-science-management/
Testi, M., Ballabio, M., Frontoni, E., Iannello, G., Moccia, S., Soda, P., & Vessio, G. (2022). MLOps: A Taxonomy and a Methodology. IEEE Access, 10, 63606–63618. https://doi.org/10.1109/ACCESS.2022.3181730
I. I. D. T. A.