Revista Colombiana de
Tecnologías de Avanzada
Tecnologías de Avanzada
Recibido: 15 de noviembre de 2022
Aceptado: 15 de enero de 2023
Aceptado: 15 de enero de 2023
APLICACIÓN DE REDES NEURONALES PARA LA CLASIFICACIÓN DE LOS NIVELES DE TENSIÓN ARTERIAL EN PACIENTES DE OCAÑA – NORTE DE SANTANDER
APPLICATION OF NEURAL NETWORKS FOR THE CLASSIFICATION OF BLOOD PRESSURE LEVELS IN PATIENTS FROM OCAÑA – NORTH OF SANTANDER
 MSc. Karla Yohana Sánchez-Mojica*, Ing. Ariel Fernández Gualdron*, Ing. Ericson Suarez Gutierrez*, MSc. José Alejandro Neira Díaz*
* Corporación Universitaria Iberoamericana, Facultad de Ingeniería, Software Engineering, Grupo de investigación y Gestión de conocimiento en Ingeniería y Ciencias básicas. GIGCIC.
Calle 67 # 5 - 27, Bogotá, Colombia.
Tel.: +601 742 65 82
E-mail: {karla.sanchez; aferna12; esuare13; jose.neira}@ibero.edu.co
APPLICATION OF NEURAL NETWORKS FOR THE CLASSIFICATION OF BLOOD PRESSURE LEVELS IN PATIENTS FROM OCAÑA – NORTH OF SANTANDER
MSc. Karla Yohana Sánchez-Mojica*, Ing. Ariel Fernández Gualdron*, Ing. Ericson Suarez Gutierrez*, MSc. José Alejandro Neira Díaz*
* Corporación Universitaria Iberoamericana, Facultad de Ingeniería, Software Engineering, Grupo de investigación y Gestión de conocimiento en Ingeniería y Ciencias básicas. GIGCIC.
Calle 67 # 5 - 27, Bogotá, Colombia.
Tel.: +601 742 65 82
E-mail: {karla.sanchez; aferna12; esuare13; jose.neira}@ibero.edu.co
Cómo citar: Sánchez Mojica, K. Y., Fernández Gualdron, A., Suarez Gutierrez, E., & Neira Díaz, J. A. (2023). APLICACIÓN DE REDES NEURONALES PARA LA CLASIFICACIÓN DE LOS NIVELES DE TENSIÓN ARTERIAL EN PACIENTES DE OCAÑA – NORTE DE SANTANDER. REVISTA COLOMBIANA DE TECNOLOGIAS DE AVANZADA (RCTA), 1(41), 36–41. Recuperado a partir de https://ojs.unipamplona.edu.co/index.php/rcta/article/view/2415
Derechos de autor 2023 Revista Colombiana de Tecnologías de Avanzada (RCTA).
Esta obra está bajo una licencia internacional Creative Commons Atribución-NoComercial 4.0.

Esta obra está bajo una licencia internacional Creative Commons Atribución-NoComercial 4.0.
Resumen: El objetivo de esta investigación es modelar el comportamiento de la tensión arterial teniendo en cuenta dos factores como edad y género en pacientes de la ciudad de Ocaña – Norte de Santander. Para el desarrollo del proyecto se tienen en cuenta las etapas fundamentales del análisis de datos: adecuación de la base de datos, análisis exploratorio, comprobación de modelos de inteligencia artificial con redes neuronales clasificatorias; el carácter de la investigación es exploratoria con un enfoque cuantitativo y diseño no experimental. Se probaron varios modelos de redes neuronales con diferentes números de capas ocultas y cantidad de neuronas; se encontró que el modelo con mayor precisión era con dos capas ocultas de 100 neuronas cada una, lo que lograba una precisión de 87%. En conclusión, se pudo determinar un modelo de redes neuronales que, con las características de género y edad, más tensión diastólica y sistólica, puede clasificar al paciente en los niveles hipotensión, hipertensión, normal, optima, hipertensión sistólica o detectar alguna anomalía.
Palabras clave: Modelo, Neurona, Nivel, Red, Tensión.
Abstract: The objective of this research is to model the behavior of blood pressure taking into account two factors such as age and gender in patients from the city of Ocaña - Norte de Santander. For the development of the project, the fundamental stages of data analysis are taken into account: adaptation of the database, exploratory analysis, verification of artificial intelligence models with classifying neural networks; the nature of the research is exploratory with a quantitative approach and non-experimental design. Various neural network models with different numbers of hidden layers and number of neurons were tested; it was found that the model with the highest precision was with two hidden layers of 100 neurons each, which achieved an accuracy of 87%. In conclusion, it was possible to determine a model of neural networks that, with the characteristics of gender and age, plus diastolic and systolic pressure, can classify the patient in the levels hypotension, hypertension, normal, optimal, systolic hypertension or detect any abnormality.
Keywords: Model, Neuron, Level, Network, Voltage.
Blood pressure, also known as arterial pressure, is the force exerted by blood against the walls of the arteries when the heart pumps it. (Alghamdi et al., 2020) Factors that can influence blood pressure include:
Artificial neural networks have been used in numerous studies to predict and analyze blood pressure. These networks can learn complex patterns and relationships from data sets and use that information to make predictions or classify new data. (Ávila-Tomás et al., 2021).
In the medical field, neural networks have been used to predict blood pressure and diagnose blood pressure-related diseases such as hypertension. Different types of data can be used to feed neural networks, such as clinical characteristics of patients, ambulatory blood pressure monitoring data, imaging data, or genetic data. (Andía et al., 2019).
In addition to blood pressure prediction, neural networks have also been used to analyze risk factors associated with hypertension and to identify subgroups of patients with specific blood pressure profiles. This can help clinicians personalize treatments and improve disease management.
Neural networks would contribute to noninvasive measurements in patients admitted to the ICU as they require constant care because of their critical condition and monitoring blood pressure is of vital importance for medical decisions. (Hill et al., 2021).
The data used in this research are provided by a health service provider and correspond to patients attended in general consultations for 6 months. It contains two of the factors that, according to the antecedents, directly affect the blood pressure of individuals; these variables are age and gender, together with systolic and diastolic pressure measurements.
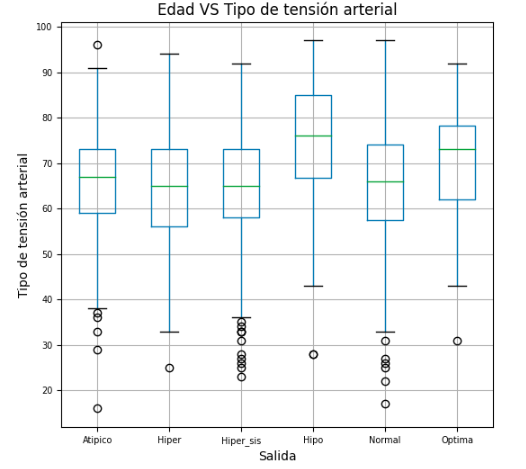
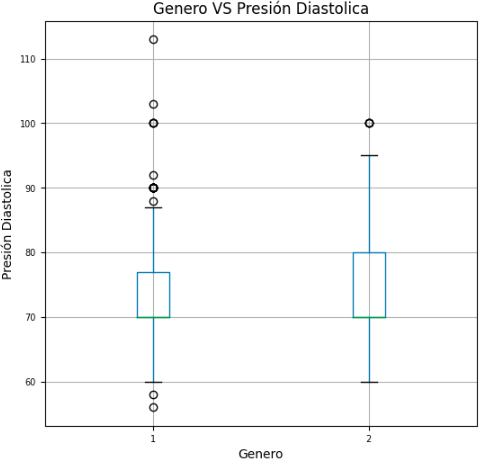
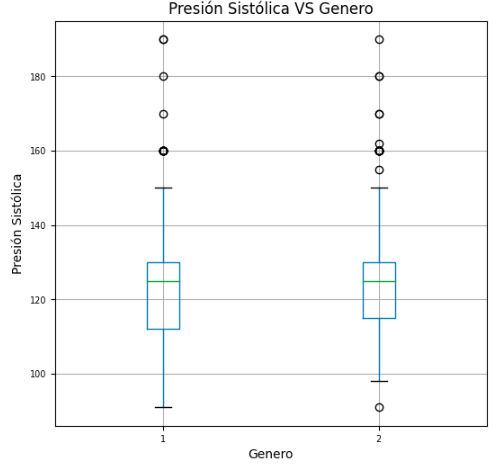
Considering the factors identified, the antecedents refer that age is one of the determinants of blood pressure behavior, Figure 1 allows suspecting that the data refers the importance of this factor. Similarly, gender tends not to affect the behavior of systolic and diastolic pressure (Figure 2).
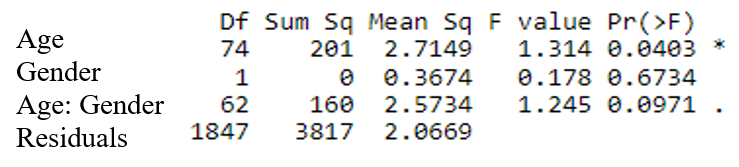
As for the analysis of variance that allows us to confirm that age is a factor that is affecting the behavior of blood pressure, gender has no influence (greater than 0.05) and a possible interaction between age and gender, the latter not significant.
As a result of the classification models, the following results are obtained:
Neural networks are trained using data sets containing information about blood pressure levels from a variety of individuals. These data include characteristics such as age and gender in the case study. Once trained, neural networks are able to analyze new data sets and classify blood pressure levels into categories such as normal, optimal, hypertension, hypotension, hypertension systolic.
By using neural networks for classification of blood pressure levels, several benefits can be obtained. First, these networks can help healthcare professionals make more accurate and faster diagnoses. By analyzing multiple features and patterns, neural networks can detect subtleties that might be missed by traditional classification methods. This can enable early intervention and better blood pressure management, which in turn can reduce the risk of cardiovascular disease and other associated complications.
Andía, M. E., Arrieta, C., & Sing Long, C. A. (2019). A conceptual guide to use and understand Big Data in clinical research. En Revista Medica Clinica Las Condes (Vol. 30, Número 1, pp. 83–94). Ediciones Doyma, S.L. https://doi.org/10.1016/j.rmclc.2018.11.003
Ávila-Tomás, J. F., Mayer-Pujadas, M. A., & Quesada-Varela, V. J. (2021). Artificial intelligence and its applications in medicine II: Current importance and practical applications. Atencion Primaria, 53(1), 81–88. https://doi.org/10.1016/j.aprim.2020.04.014
Bukhari, M. M., Alkhamees, B. F., Hussain, S., Gumaei, A., Assiri, A., & Ullah, S. S. (2021). An Improved Artificial Neural Network Model for Effective Diabetes Prediction. Complexity, 2021. https://doi.org/10.1155/2021/5525271
Delgado Karina, Ledesma Sergio, & Rostro Horacio. (2019). Análisis de electroencefalograma usando redes neuronales artificiales. Multidisciplinary Science Journal, 29, 1–24.
Esmaelpoor, J., Moradi, M. H., & Kadkhodamohammadi, A. (2020). A multistage deep neural network model for blood pressure estimation using photoplethysmogram signals. Computers in Biology and Medicine, 120. https://doi.org/10.1016/j.compbiomed.2020.103719
Hill, B. L., Rakocz, N., Rudas, Á., Chiang, J. N., Wang, S., Hofer, I., Cannesson, M., & Halperin, E. (2021). Imputation of the continuous arterial line blood pressure waveform from non-invasive measurements using deep learning. Scientific Reports, 11(1). https://doi.org/10.1038/s41598-021-94913-y
López-Martínez, F., Núñez-Valdez, E. R., Crespo, R. G., & García-Díaz, V. (2020). An artificial neural network approach for predicting hypertension using NHANES data. Scientific Reports, 10(1). https://doi.org/10.1038/s41598-020-67640-z
Martinez-Ríos, E., Montesinos, L., Alfaro-Ponce, M., & Pecchia, L. (2021). A review of machine learning in hypertension detection and blood pressure estimation based on clinical and physiological data. En Biomedical Signal Processing and Control (Vol. 68). Elsevier Ltd. https://doi.org/10.1016/j.bspc.2021.102813
Sarmiento-Ramos, J. L. (2020). Aplicaciones de las redes neuronales y el deep learning a la ingeniería biomédica. Revista UIS Ingenierías, 19(4), 1–18. https://doi.org/10.18273/revuin.v19n4-2020001
Palabras clave: Modelo, Neurona, Nivel, Red, Tensión.
Abstract: The objective of this research is to model the behavior of blood pressure taking into account two factors such as age and gender in patients from the city of Ocaña - Norte de Santander. For the development of the project, the fundamental stages of data analysis are taken into account: adaptation of the database, exploratory analysis, verification of artificial intelligence models with classifying neural networks; the nature of the research is exploratory with a quantitative approach and non-experimental design. Various neural network models with different numbers of hidden layers and number of neurons were tested; it was found that the model with the highest precision was with two hidden layers of 100 neurons each, which achieved an accuracy of 87%. In conclusion, it was possible to determine a model of neural networks that, with the characteristics of gender and age, plus diastolic and systolic pressure, can classify the patient in the levels hypotension, hypertension, normal, optimal, systolic hypertension or detect any abnormality.
Keywords: Model, Neuron, Level, Network, Voltage.
1. INTRODUCTION
The use of Big Data is fundamental in the development of a neural network application, it is undeniable its importance in medical advancement through the massive collection of clinical data which allows us to feed the neural network with a set of diverse data with which it will learn patterns trends and characteristics that allow us to identify possible diseases (Bukhari et al., 2021). It works in an interdisciplinary way to achieve important advances in medicine, seeking to impact on the health and well-being of people (Sarmiento-Ramos, 2020).Blood pressure, also known as arterial pressure, is the force exerted by blood against the walls of the arteries when the heart pumps it. (Alghamdi et al., 2020) Factors that can influence blood pressure include:
- Age: As we age, we are more likely to experience an increase in blood pressure. This is because arteries become less flexible over time.
- Gender: Before menopause, women tend to have lower blood pressure than men. After menopause, the difference tends to disappear and women have a higher risk of developing hypertension.
- Genetics: There is evidence that genetic predisposition can influence blood pressure. If you have a family history of hypertension, you may have a higher risk of developing it.
- Lifestyle: Factors such as unhealthy diet, excessive salt intake, lack of physical activity, tobacco use and alcohol consumption can increase the risk of developing hypertension.
- Body weight: Excess weight and obesity are associated with an increased risk of hypertension. Extra fat tissue requires more blood flow, which can put pressure on the arteries.
- Physical activity levels: Lack of physical activity can contribute to the development of hypertension. Regular exercise helps strengthen the heart and improve blood vessel health.
- Salt intake: A diet high in sodium can increase fluid retention and lead to increased blood pressure. It is recommended to limit salt intake to less than 2.3 grams per day.
- Stress: Chronic stress can affect blood pressure. During periods of stress, the body releases hormones that can constrict blood vessels and increase blood pressure. (Lopez-Martinez et al., 2020; Martinez-Rios et al., 2021).
Artificial neural networks have been used in numerous studies to predict and analyze blood pressure. These networks can learn complex patterns and relationships from data sets and use that information to make predictions or classify new data. (Ávila-Tomás et al., 2021).
In the medical field, neural networks have been used to predict blood pressure and diagnose blood pressure-related diseases such as hypertension. Different types of data can be used to feed neural networks, such as clinical characteristics of patients, ambulatory blood pressure monitoring data, imaging data, or genetic data. (Andía et al., 2019).
In addition to blood pressure prediction, neural networks have also been used to analyze risk factors associated with hypertension and to identify subgroups of patients with specific blood pressure profiles. This can help clinicians personalize treatments and improve disease management.
Neural networks would contribute to noninvasive measurements in patients admitted to the ICU as they require constant care because of their critical condition and monitoring blood pressure is of vital importance for medical decisions. (Hill et al., 2021).
2. METHODOLOGY
Neural networks can be used to classify blood pressure levels into different categories. This approach is known as multiclass classification, where a label is assigned to each blood pressure level. Here is the step-by-step of how neural networks were used to classify blood pressure levels into five categories: hypotension, normal, optimal, prehypertension, and hypertension (Delgado Karina et al., 2019).- Data collection: data are collected from patients including relevant characteristics such as age, gender, along with their blood pressure levels.
- Data preparation: The collected data is divided into training, validation, and test sets. In addition, the data are normalized to ensure that all features have a similar scale and to prevent any one feature from dominating over the others.
- Neural network design: The neural network architecture is chosen. In this case, a feedforward neural network is used, but several models with different layers and different numbers of neurons are made to determine which one works best.
- Training the neural network: The training set is used to train the neural network. During training, the network adjusts the weights and biases of its connections to minimize the error between the predicted outputs and the actual outputs. This is done using optimization algorithms, such as gradient descent.
- Neural network validation: The validation set is used to evaluate the performance of the neural network during training on each model. This helps to adjust the neural network hyper parameters and avoid overfitting.
- Neural network testing: Once the neural network has been trained and validated, the test set is used to evaluate its final performance. The classification accuracy is evaluated and the predictions of the different models are compared with the actual blood pressure levels. (Esmaelpoor et al., 2020).
The data used in this research are provided by a health service provider and correspond to patients attended in general consultations for 6 months. It contains two of the factors that, according to the antecedents, directly affect the blood pressure of individuals; these variables are age and gender, together with systolic and diastolic pressure measurements.
3. RESULTS
An exploration of the data shows that the average age of the patients recorded in the data is 65 years, with an unmarked majority of female gender and with average systolic pressures 123 with an average diastolic of 73. The maximum age recorded is 97 years.Considering the factors identified, the antecedents refer that age is one of the determinants of blood pressure behavior, Figure 1 allows suspecting that the data refers the importance of this factor. Similarly, gender tends not to affect the behavior of systolic and diastolic pressure (Figure 2).
Fig. 1. Graph of age behavior with respect to blood pressure behavior.
(a)
(b)
Fig. 2. Graph of systolic and diastolic pressure behavior with respect to gender (a) female and (b) male.
In the correlation analysis, the same behavior of the age and gender factors with respect to blood pressure can be identified:Fig. 2. Graph of systolic and diastolic pressure behavior with respect to gender (a) female and (b) male.
Table 1: Correlation of variables
| Edad | Género | Sistólica | Diastólica | |
|---|---|---|---|---|
| Age | 1 | -0.083 | 0.62 | 0.54 |
| Gender | 1 | 0.043 | 0.038 | |
| Systolic | 1 | 0.64 | ||
| Diastolic | 1 |
Source: Own elaboration
As for the analysis of variance that allows us to confirm that age is a factor that is affecting the behavior of blood pressure, gender has no influence (greater than 0.05) and a possible interaction between age and gender, the latter not significant.
Fig. 3. Analysis of variance for age, gender and interaction factors with respect to blood pressure.
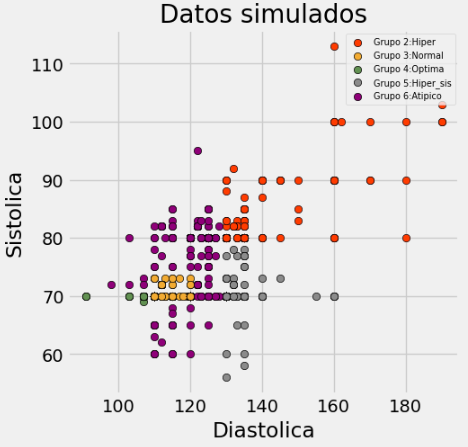
Four models with different numbers of neurons and different hidden layers are evaluated for the development of the neural network, as shown in the table below:
Fig. 4. representation of the data.
Table 2: Classification models executed
| Model | Hidden layers | # de neurons | Learning rate | Solver | Max_iter |
|---|---|---|---|---|---|
| M1 | 1 | 10 | 0.01 | lbfgs | 1000 |
| M2 | 2 | 50 | 0.01 | lbfgs | 5000 |
| M3 | 2 | 100 | 0.01 | lbfgs | 5000 |
| M4 | 3 | 200 | 0.01 | lbfgs | 7000 |
Source: Own elaboration
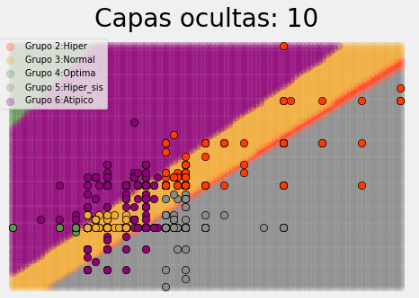
As a result of the classification models, the following results are obtained:
Fig. 5. Predictions of proposed model 1.
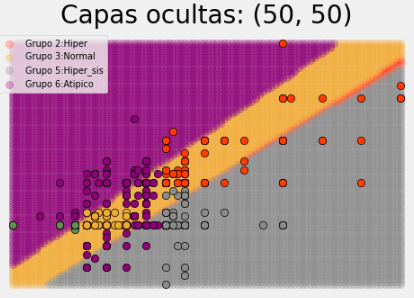
Fig. 6. Predictions of proposed model 2.
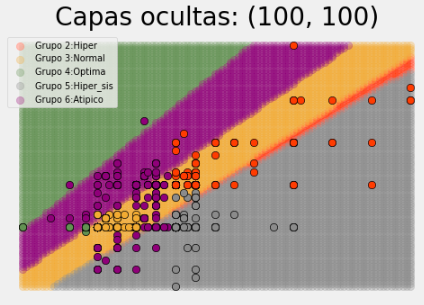
Fig. 7. Predictions of proposed model 3.
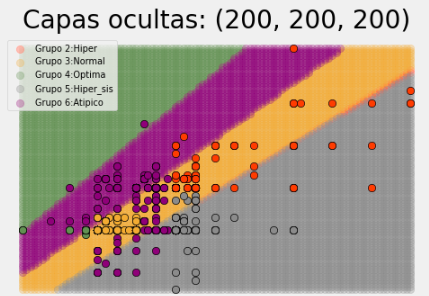
Fig. 8. Predictions of proposed model 4.
It can be seen that of the models the one that best fits the behavior of the data is model 3 with two hidden layers with 100 neurons each; model 1 and 2 tend to leave blood pressure groups unclassified. Model 4 of three hidden layers with 200 neurons does not show much improvement in classification with respect to model 3 and does consume more resources for its execution, along with classification time; the latter model has an accuracy of 87%.4. CONCLUSIONS
In conclusion, neural networks applied to the classification of blood pressure levels are a promising and effective tool to aid in the diagnosis and monitoring of blood pressure. These basic neural networks, which are mathematical models inspired by the functioning of the human brain, may become capable of processing large amounts of data and extracting complex patterns such as outlier data displayed for direct monitoring by physicians under prompt responses to patients, making them a viable option to address the classification of blood pressure levels.Neural networks are trained using data sets containing information about blood pressure levels from a variety of individuals. These data include characteristics such as age and gender in the case study. Once trained, neural networks are able to analyze new data sets and classify blood pressure levels into categories such as normal, optimal, hypertension, hypotension, hypertension systolic.
By using neural networks for classification of blood pressure levels, several benefits can be obtained. First, these networks can help healthcare professionals make more accurate and faster diagnoses. By analyzing multiple features and patterns, neural networks can detect subtleties that might be missed by traditional classification methods. This can enable early intervention and better blood pressure management, which in turn can reduce the risk of cardiovascular disease and other associated complications.
5. REFERENCES
Alghamdi, A. S., Polat, K., Alghoson, A., Alshdadi, A. A., & Abd El-Latif, A. A. (2020). A novel blood pressure estimation method based on the classification of oscillometric waveforms using machine-learning methods. Applied Acoustics, 164. https://doi.org/10.1016/j.apacoust.2020.107279Andía, M. E., Arrieta, C., & Sing Long, C. A. (2019). A conceptual guide to use and understand Big Data in clinical research. En Revista Medica Clinica Las Condes (Vol. 30, Número 1, pp. 83–94). Ediciones Doyma, S.L. https://doi.org/10.1016/j.rmclc.2018.11.003
Ávila-Tomás, J. F., Mayer-Pujadas, M. A., & Quesada-Varela, V. J. (2021). Artificial intelligence and its applications in medicine II: Current importance and practical applications. Atencion Primaria, 53(1), 81–88. https://doi.org/10.1016/j.aprim.2020.04.014
Bukhari, M. M., Alkhamees, B. F., Hussain, S., Gumaei, A., Assiri, A., & Ullah, S. S. (2021). An Improved Artificial Neural Network Model for Effective Diabetes Prediction. Complexity, 2021. https://doi.org/10.1155/2021/5525271
Delgado Karina, Ledesma Sergio, & Rostro Horacio. (2019). Análisis de electroencefalograma usando redes neuronales artificiales. Multidisciplinary Science Journal, 29, 1–24.
Esmaelpoor, J., Moradi, M. H., & Kadkhodamohammadi, A. (2020). A multistage deep neural network model for blood pressure estimation using photoplethysmogram signals. Computers in Biology and Medicine, 120. https://doi.org/10.1016/j.compbiomed.2020.103719
Hill, B. L., Rakocz, N., Rudas, Á., Chiang, J. N., Wang, S., Hofer, I., Cannesson, M., & Halperin, E. (2021). Imputation of the continuous arterial line blood pressure waveform from non-invasive measurements using deep learning. Scientific Reports, 11(1). https://doi.org/10.1038/s41598-021-94913-y
López-Martínez, F., Núñez-Valdez, E. R., Crespo, R. G., & García-Díaz, V. (2020). An artificial neural network approach for predicting hypertension using NHANES data. Scientific Reports, 10(1). https://doi.org/10.1038/s41598-020-67640-z
Martinez-Ríos, E., Montesinos, L., Alfaro-Ponce, M., & Pecchia, L. (2021). A review of machine learning in hypertension detection and blood pressure estimation based on clinical and physiological data. En Biomedical Signal Processing and Control (Vol. 68). Elsevier Ltd. https://doi.org/10.1016/j.bspc.2021.102813
Sarmiento-Ramos, J. L. (2020). Aplicaciones de las redes neuronales y el deep learning a la ingeniería biomédica. Revista UIS Ingenierías, 19(4), 1–18. https://doi.org/10.18273/revuin.v19n4-2020001
Universidad de Pamplona
I. I. D. T. A.
I. I. D. T. A.