Revista Colombiana de
Tecnologías de Avanzada
Tecnologías de Avanzada
Recibido: 17 de abril de 2022
Aceptado: 15 de julio de 2022
Aceptado: 15 de julio de 2022
SIMULATION OF AN ELECTROCARDIOGRAPHIC SYSTEM FOR THE DETECTION OF CARDIAC PATHOLOGIES
SIMULACIÓN DE UN SISTEMA ELECTROCARDIOGRÁFICO PARA LA DETECCIÓN DE PATOLOGÍAS CARDÍACAS
 Camilo Pardo-Beainy*,
 Angie Aponte-Sanguino*,
 Angela Pacheco Aponte*,
 Iván Porras Piñeres*
* Universidad Santo Tomás,Electronic Engineering Faculty.
Tunja, Boyacá Colombia.
Tel: 57-8-7440404, Ext. 5612
E-mail: {camilo.pardo, angie.aponte, angela.pacheco, ivan.porras}@usantoto.edu.co.
SIMULACIÓN DE UN SISTEMA ELECTROCARDIOGRÁFICO PARA LA DETECCIÓN DE PATOLOGÍAS CARDÍACAS
 Camilo Pardo-Beainy*,
 Angie Aponte-Sanguino*,
 Angela Pacheco Aponte*,
 Iván Porras Piñeres*
* Universidad Santo Tomás,Electronic Engineering Faculty.
Tunja, Boyacá Colombia.
Tel: 57-8-7440404, Ext. 5612
E-mail: {camilo.pardo, angie.aponte, angela.pacheco, ivan.porras}@usantoto.edu.co.
Cómo citar: Pardo Beainy, C., Aponte Sanguino, A., Pacheco Aponte, A., & Porras Piñeres, I.
(2022). SIMULACIÓN DE UN SISTEMA ELECTROCARDIOGRÁFICO PARA LA DETECCIÓN DE PATOLOGÍAS CARDÍACAS. REVISTA
COLOMBIANA DE TECNOLOGIAS DE AVANZADA (RCTA), 2(40), 53-61.https://doi.org/10.24054/rcta.v2i40.2352
Derechos de autor 2022 Revista Colombiana de Tecnologías de Avanzada (RCTA).
Esta obra está bajo una licencia internacional Creative Commons Atribución-NoComercial 4.0.

Esta obra está bajo una licencia internacional Creative Commons Atribución-NoComercial 4.0.

Abstract: With the objective of designing an electrocardiographic system simulator for the
detection of cardiac pathologies making their respective diagnosis, this project is carried out in 4 stages:
the first refers to the modelling and mathematical analysis of the EKG normal signal and four pathologies to
study (bradycardia, tachycardia, atrial fibrillation and ventricular fibrillation). In a second moment, it
seeks to design an electrocardiograph, which allows amplifying the simulated signal of the patient and
filtering a 60Hz noise signal added to it. In the third stage, the acquisition and processing of the signal
through the Matlab software is presented. Finally, the fourth and last stage consists of the diagnosis of
the patient through the comparison of the Power Spectral Density (PSD) of the acquired signal with the
signals that have been stored and processed.
Keywords: EKG, heart diseases, Matlab, PSD, signal processing.
Resumen: Con el objetivo de diseñar un simulador de sistema electrocardiográfico para la detección de patologías cardíacas realizando su respectivo diagnóstico, se lleva a cabo el presente proyecto, el cual, consta de 4 etapas: la primera se refiere al modelado y análisis matemático de la señal ECG normal y cuatro patologías a estudiar (bradicardia, taquicardia, fibrilación auricular y fibrilación ventricular), en un segundo momento, se busca realizar el diseño de un electrocardiógrafo que permita amplificar la señal simulada del paciente y filtrar una señal de ruido de 60Hz sumada a la misma, como tercera etapa, se presenta la adquisición y procesamiento de la señal por medio del software Matlab, para finalmente llegar a la cuarta y última etapa que consiste en el diagnóstico del paciente por medio de la comparación de la Densidad Espectral de Potencia (PSD) de la señal adquirida con las señales que han sido almacenadas y tratadas.
Palabras clave: ECG, enfermedades cardiacas, Matlab, PSD, procesamiento de señales.
In addition, several methods have been used to achieve a correct classification of heartbeats. So, this analysis can be performed in the time domain, taking values of amplitude, wave height and number of samples, while other analyses involve parameters such as frequency, phase and the characteristics of their components
In recent studies, according to Romero
In this way, the present project includes the design of an electrocardiographic system simulator for the detection of cardiac pathologies, carrying out their respective diagnosis. For which, the modeling and the mathematical analysis of the electrocardiographic signals from different types corresponding to a normal EKG signal and four different types of pathologies are performed. An electrocardiograph is designed through the use of operational amplifiers to acquire the respective electrocardiographic signal and, finally, the electrocardiographic signal acquired is digitally processed in the time and frequency domains to give a final diagnosis of the patient's condition.
Therefore, it is designed a first inverting attenuator with an attenuation factor of 243.75x10⁻⁶, followed by an inverting voltage follower amplifier to obtain the correct shape of the signal. At the output, around 1.18 mV are obtained, a value small enough to be able to take advantage of the instrumentation amplifier (Figure 5). In addition, the attenuated signal had to be given an offset level adjusted by the DAC amplifier to avoid problems with the signal in the later stages of the electrocardiograph.
In this way, a gain value of approximately 4118 is adjusted to obtain a value close to 5 V at the output. The circuit is as follows:
To perform the analysis by the method of the PSD, it was necessary to acquire the signal through the process of sending it since Proteus to Matlab. Once it is captured, it is stored in a data vector in which the respective PSD analysis is performed by means of the periogram () function. After this, there are the peaks in which the characteristic frequencies of each spectrum are presented, in such a way that with the findpeaks () command, it is possible to distinguish the differences between the densities for each case.


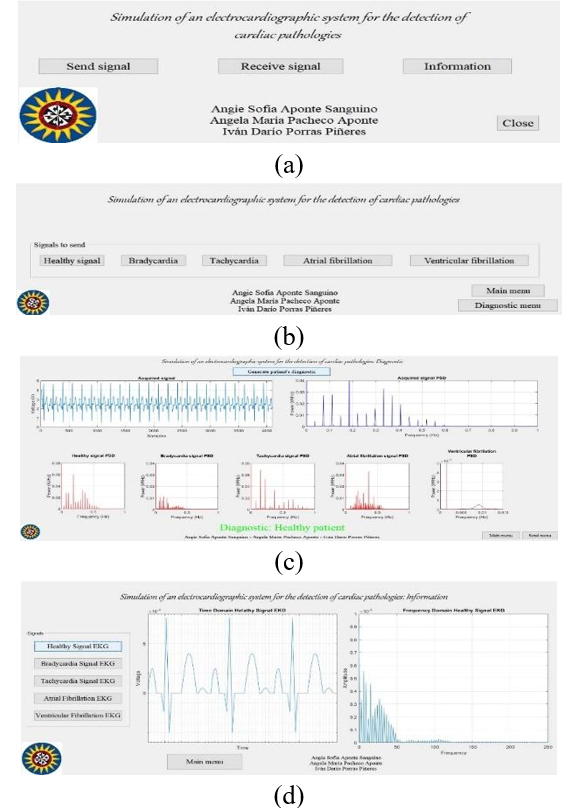
The second menu refers to the diagnosis (Figure 15c), where the user can choose the time in which he wants to start the process. In addition, both the incoming signal with its respective spectral density graph and the spectral densities of each of the saved signals are presented. Once the diagnostic process is completed, these graphs will be visible and the patient's diagnosis will be displayed at the bottom. Additionally, in the lower right place there are two buttons, the first one allows the user to return to the main menu, while the second one gives the option to select a new signal.
Finally, the third menu, which corresponds to the Information menu (Figure 15d), presents an aid to visualize time and frequency from each of the signals studied. Besides, there is a button that allows the user to return to the main menu.
Through the use of operational amplifiers, the design of an electrocardiographic system was achieved. This one can amplify the signals in order to encompass all the conversion window of the microcontroller in charge of the serial communication with the Matlab program, filtering at the same time the 60 Hz noise frequency of the electric supply. In parallel, it was designed a system capable of simulate a real patient heart conditions, by the acquisition of a signal through a microcontroller and reducing its voltage from 5 V to 1.17 mV. This value is concordant with the mathematical model applied in order to design the signals in Matlab.
Through the use of asynchronous serial communication by means of the creation of virtual ports, it was possible to make the connection between programs (Matlab and Proteus), in which it is possible to preset the cardiac characteristics of the patient in Proteus depending on the previous selection requested by the user in Matlab. Likewise, thanks to this communication, it is possible to send the treated signal to Matlab for its later acquisition and diagnosis.
By the use of the software Matlab, when changing from time to frequency domain and comparing the Power Spectral Density of acquired signal by means of the electrographic system and the saved signals in the program, it is possible to give a dictum of the patient’s conditions, through the identification of the minimal error during the comparison process.
An electrographic system was designed. This one is capable of performing a medical dictum of the simulated patient status based on the acquisition of its vital signs and comparing it with five different signals which are saved in the program. All this is made by the use of analogic methods (Proteus software) and digital methods by using Matlab, performing a time and frequency domains analysis.
Beta Móvil. (2019). Notificaciones de Ritmo irregular y ECG, qué son y cómo funcionan | Beta Móvil. https://www.betamovil.com/notificaciones-de-ritmo-irregular-y-ecg-que-son-y-como-funcionan/
Bistel, R., & Fajardo, A. (2015). Design of a System for Acquisition and Processing ECG´s Signals based on Virtual Instrumentation. RIELAC, 1, 17–30.
Cantillo Maldonado, A., Gualdron Guerrero, O., & Ortiz Sandoval, J. (2018). Signal Processing EMG in an Embedded System for Control Neuronal of a Robotic Arm. Revista Colombiana de Tecnologías de Avanzada, 2(32), 139–147. https://doi.org/10.24054/16927257.v32.n32.2018.3037
García, M. (2015). Procesado de Señales Cardiacas: Análisis de Organización de Fourier. 89.
Jorge, H. V. (2017). ECG 7.2 Ritmo sinusal, arritmias del nodo sinusal - Cardio Science. https://www.cardioscience.com.mx/nota.php?id=263
Li, H., Hu, Y., & Wang, S. (2020). Signal Detection Based on Power-Spectrum Sub-Band. https://doi.org/10.3390/electronics10010064
Marcela, G. V., & Ximena, M. O. (2009). Análisis De Señales Electrocardiográficas (ECG) Con Isquemia Cardiaca Usando Técnicas De Procesamiento Digital De Señales. Aspectos Generales De La Planificación Tributaria En Venezuela, 2009(75), 31–47.
Material Médico. (2017). Electrocardiógrafo. https://materialmedico.org/electrocardiografo/
MATLAB. (2020). Power Spectral Density Estimates Using FFT - MATLAB & Simulink - MathWorks Deutschland. https://de.mathworks.com/help/signal/ug/power-spectral-density-estimates-using-fft.html
Practical Clinical Skills. (2020a). Fibrilación Ventricular Guía de referencia. https://www.practicalclinicalskills.com/ekg-reference-guide-details-es?lessonid=26
Practical Clinical Skills. (2020b). Taquicardia Sinusal Guía de referencia. https://www.practicalclinicalskills.com/ekg-reference-guide-details-es?lessonid=2
Prasad, B. V. P., & Parthasarathy, V. (2018). Detection and classification of cardiovascular abnormalities using FFT based multi-objective genetic algorithm. Biotechnology and Biotechnological Equipment, 32(1), 183–193. https://doi.org/10.1080/13102818.2017.1389303
Ramírez, V., & Dorantes, G. (2017). Probits : Interfaz Gráfica para la Adquisición y Procesamiento de Señales Biomédicas con la Tarjeta Bitalino. Sociedad Mexicana de Ingeniería Biomedica, 282–285.
Rohde & Scjwarz. (2020). Captura de señales de electrocardiogramas pequeñas en aplicaciones médicas | Rohde & Schwarz. https://www.rohde-schwarz.com/es/aplicaciones/captura-de-se-ales-de-electrocardiogramas-peque-as-en-aplicaciones-m-dicas-ficha-de-aplicacion_56279-152385.html?rusprivacypolicy=0
Romero, J. L. (2015). Análisis de Señales Electrocardiográficas usando técnicas de procesamiento digital. Universidad Oberta de Catalunya., 1, 45.
Romo, Á., & Martínez, J. (2019). Diseño De Un Sistema Para El Análisis De Señales Dinámicas Electromiográficas En Estudios De Ergonomía Basado En Técnicas Temporales y Frecuenciales. https://riunet.upv.es/bitstream/handle/10251/159590/51506258N_TFM_15949262307664331268895100267838.pdf?sequence=2
Sedra, A., & Smith, K. (2015). Microelectronic Circuits (OXFORD Uni).
SEMERGEN Cantabria. (n.d.). ECG - valores normales. Retrieved January 19, 2021, from http://www.semergencantabria.org/calc/bmcalc.htm
Siza, R., Cazar, D., & Cortez, M. (2013). Análisis de señales cardiovasculares utilizando técnicas de procesamiento digital de señales. Perfiles, 76.
Texas Instruments. (2015). INA129-EP Precision, Low Power Instrumentation Amplifiers.
Keywords: EKG, heart diseases, Matlab, PSD, signal processing.
Resumen: Con el objetivo de diseñar un simulador de sistema electrocardiográfico para la detección de patologías cardíacas realizando su respectivo diagnóstico, se lleva a cabo el presente proyecto, el cual, consta de 4 etapas: la primera se refiere al modelado y análisis matemático de la señal ECG normal y cuatro patologías a estudiar (bradicardia, taquicardia, fibrilación auricular y fibrilación ventricular), en un segundo momento, se busca realizar el diseño de un electrocardiógrafo que permita amplificar la señal simulada del paciente y filtrar una señal de ruido de 60Hz sumada a la misma, como tercera etapa, se presenta la adquisición y procesamiento de la señal por medio del software Matlab, para finalmente llegar a la cuarta y última etapa que consiste en el diagnóstico del paciente por medio de la comparación de la Densidad Espectral de Potencia (PSD) de la señal adquirida con las señales que han sido almacenadas y tratadas.
Palabras clave: ECG, enfermedades cardiacas, Matlab, PSD, procesamiento de señales.
1. INTRODUCCIÓN
The electrocardiogram (also called EKG) is a graphic representation of the electrical impulses generated by the heart, which allows diagnosing if the person has any type of disease depending on the shape and duration of the P wave, the T wave and the complexes Q, R and S(Romero, 2015)
. The medical instrument that captures
and amplifies the electrical impulses of the heart and allows obtaining the EKG is called an
electrocardiograph, which, through recording electrodes placed on the surface of the body, detects
electrical potentials of approximately one millivolt (1 mV). One of the drawbacks when acquiring
electrophysiological signals (as is the case with electrocardiography) occurs when there is interference
that decreases the quality of obtaining the signal, so it is advisable that the devices responsible for
acquiring these signals have specialized filters to reduce possible noise signals.
Análisis de Señales Electrocardiográficas usando técnicas de procesamiento
digital. Universidad Oberta de Catalunya., 1, 45.
In addition, several methods have been used to achieve a correct classification of heartbeats. So, this analysis can be performed in the time domain, taking values of amplitude, wave height and number of samples, while other analyses involve parameters such as frequency, phase and the characteristics of their components
(Bistel & Fajardo, 2015)
. One of the methods that involve the frequency analysis of the EKG signal is called
Power Spectral Density (PSD), which determines the distribution of the power of a signal over a frequency
interval. If the power spectrum is calculated using the Fourier transform and is subsequently averaged, then
it is known as a periodogram (a method that will be used in the present work for the diagnostic of EKG
signals) Design of a System for Acquisition
and Processing ECG´s Signals based on Virtual Instrumentation. RIELAC, 1, 17–30.
(Romo & Martínez, 2019)
.
Diseño De Un Sistema Para El
Análisis De Señales Dinámicas Electromiográficas En Estudios De Ergonomía Basado En Técnicas
Temporales y Frecuenciales. https://riunet.upv.es/bitstream/handle/10251/159590/51506258N_TFM_15949262307664331268895100267838.pdf?sequence=2.
In recent studies, according to Romero
(Romero, 2015)
, it is possible to model an electrocardiographic
signal in each of its component parts (Waves and straight lines) and carry out its treatment by using
low-pass filters and Wavelet transform. In addition, under the conception of Siza, Cazar and Cortez
Análisis
de Señales Electrocardiográficas usando técnicas de procesamiento digital. Universidad Oberta de
Catalunya., 1, 45.
(Siza et al., 2013)
the design of each section of the signal is carried out through the Scilab Software and, using
the Fourier theorem, a similar model to an electrocardiographic is obtained. Taking into account the study
carried out by Prasad and Parthasarathy Análisis de señales
cardiovasculares utilizando técnicas de procesamiento digital de señales. Perfiles, 76.
(Prasad & Parthasarathy, 2018)
the data of the signals to be used
are taken from the MIT-BIT arrhythmia database, a low pass filter is used to filter the components of the
signal seeking to eliminate the disturbances for its analysis. The characteristics of the filtered signal
are extracted with the help of a FFT. The signal is separated into two DFTs of four points. With them, the
frequency of components in the incoming wave are trapped and, through the fuzzy logic method, it is assessed
how different this waveform is from the arrhythmia database in terms of "Normal, Severe, or Critical."
Regarding the analysis of the EKG signal, González and Martínez Detection and classification of cardiovascular abnormalities using FFT based
multi-objective genetic algorithm. Biotechnology and Biotechnological Equipment, 32(1), 183–193. https://doi.org/10.1080/13102818.2017.1389303
(Marcela & Ximena,
2009)
use methods such
as: DFT, FFT, DST and WT. Another method of processing electrocardiographic signals found is called Fourier
Organization Analysis (FOA), described by García Análisis De Señales Electrocardiográficas (ECG) Con Isquemia Cardiaca
Usando Técnicas De Procesamiento Digital De Señales. Aspectos Generales De La Planificación
Tributaria En Venezuela, 2009(75), 31–47.
(García, 2015)
, where he studies signals with the pathology
of atrial fibrillation analyzed with intracardiac recordings (EGM). The aim of this work is to implement an
algorithm that is able to calculate the fundamental frequency using the FOA technique. The signal processing
starts with the phase of synthetic modeling of the wave in order to have a control of the parameters to know
the result and to check the correct functioning of the designed algorithm Procesado de Señales Cardiacas: Análisis de Organización de Fourier. 89.
(Cantillo
Maldonado et al., 2018)
After this, the filtering of the signal obtained by means of the use of low-pass and high-pass
filters is
carried out, to finally detect the fundamental frequency. However, in the work carried out by Ramírez &
Dorantes Signal Processing EMG in
an Embedded System for Control Neuronal of a Robotic Arm. Revista Colombiana de Tecnologías de
Avanzada, 2(32), 139–147. https://doi.org/10.24054/16927257.v32.n32.2018.3037
(Ramírez & Dorantes, 2017)
, it is proposed to use PSD as a way of analysis that shows the power
distribution of a signal as a function of frequency and, thus, identify the most important frequency
components.
Probits : Interfaz Gráfica
para la Adquisición y Procesamiento de Señales Biomédicas con la Tarjeta Bitalino. Sociedad Mexicana
de Ingeniería Biomedica, 282–285.
In this way, the present project includes the design of an electrocardiographic system simulator for the detection of cardiac pathologies, carrying out their respective diagnosis. For which, the modeling and the mathematical analysis of the electrocardiographic signals from different types corresponding to a normal EKG signal and four different types of pathologies are performed. An electrocardiograph is designed through the use of operational amplifiers to acquire the respective electrocardiographic signal and, finally, the electrocardiographic signal acquired is digitally processed in the time and frequency domains to give a final diagnosis of the patient's condition.
2. METHODOLOGY
2.1 Block diagram
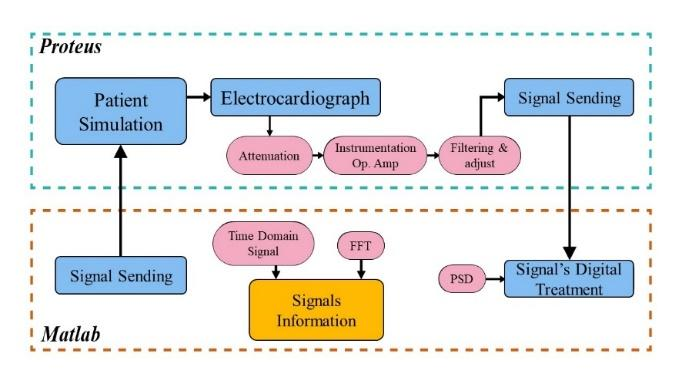
In Figure 1, the block diagram presents how the project is carried out. It is made up of two sections: the first corresponds to the analog treatment (based on the application of operational amplifiers and active filters) of the electrocardiographic signal for the simulation and the second represents the digital treatment of the EKG signal for the detection of the pathology using the Power Spectral Density (PSD). Besides, in order to analyze the different pathologies, it is displayed the frequency spectra of the signals to distinguish the characteristics of each one. In addition, there is the "Signal Sending" block, which is responsible for the union of the two sections, this union is done through asynchronous serial communication using virtual ports.
Fig. 1. Block diagram of the project
2.2 Flux diagram
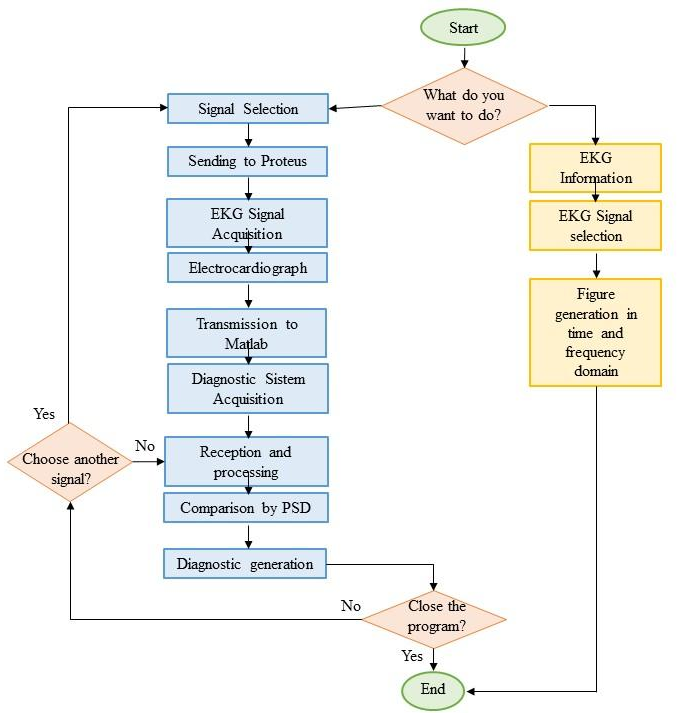
In Figure 2 the flow chart under which the system works is presented. This diagram presents the possible options that the user can choose, either, to select a signal to send the patient simulation system and subsequent detection of the pathology or to receive information about each of the signals to be analyzed.
Fig. 2. Flux diagram of the project
2.3 Signals modeling
For the development of the project, it was carried out the design of the different signals to be used as simulation of patients. Below, the values given for them will be presented:2.3.1 Healthy signal
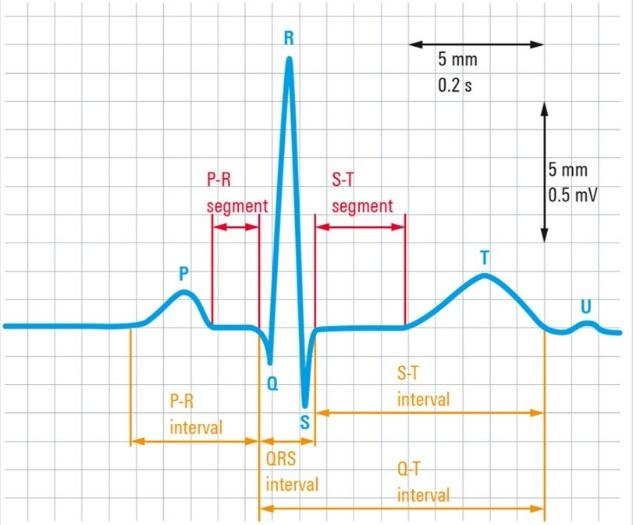
For the signals design, the measurements of a millimetric electrocardiogram paper are taken into account (Figure 3), where each frame has a Y value of 0.1 mV and an X value of 0.04 s(SEMERGEN
Cantabria, n.d.)
. In
this way, it was possible to model each of the waves and intervals that make up the normal ECG signal and
the different pathologies, considering the characteristics of each one.
ECG - valores normales. Retrieved January 19, 2021, from http://www.semergencantabria.org/calc/bmcalc.htm.

Fig. 3. Normal EKG signal
The healthy signal can be modeled by using straight lines and trigonometric functions, in Table 1 these
functions are presented from the P wave to the U wave in their respective order.
(Rohde & Scjwarz, 2020)
Captura de señales de
electrocardiogramas pequeñas en aplicaciones médicas | Rohde & Schwarz. https://www.rohde-schwarz.com/es/aplicaciones/captura-de-se-ales-de-electrocardiogramas-peque-as-en-aplicaciones-m-dicas-ficha-de-aplicacion_56279-152385.html?rusprivacypolicy=0.
Table 1: Modeling Signals
| \( p=(μ_{(t)}-μ_{(t-0.1)})\cdot(0.25mV\cdot\sin\sin(10\pi\cdot t)) \) |
| \( q_1=(μ_{(t-0.16s)}-μ_{(t-0.19s)})(-6.33 \cdot \frac{mV}{s}\cdot t+1.01mV) \) |
| \( q_2=(μ_{(t-0.19s)}-μ_{(t-0.196s)})(32 \cdot \frac{mV}{s}\cdot t-6.27mV) \) |
| \( r_1=(μ_{(t-0.196s)}-μ_{(t-0.22s)})\cdot(32 \cdot \frac{mV}{s}\cdot t-6.27mV) \) |
| \( r_2=(μ_{(t-0.22s)}-μ_{(t-0.243)})(-33.47 \cdot \frac{mV}{s}\cdot t+8.13mV) \) |
| \( s_1=(μ_{(t-0.22s)}-μ_{(t-0.255)})(-33.47 \cdot \frac{mV}{s}\cdot t+8.13mV) \) |
| \( s_2=(μ_{(t-0.255)}-μ_{(0.28)})\cdot(16 \cdot \frac{mV}{s}\cdot t-4.48mV) \) |
| \( t=(μ_{(t-0.4s)}-μ_{(t-0.58s)})(0.4mV\cdot\sin(\frac{2\pi}{0.36s\cdot t}-0.69)) \) |
| \( u=(μ_{(t-0.6s)}-μ_{(t-0.7s)})(0.05mV\cdot\sin\sin(10\pi\cdot t)) \) |
2.3.2 Bradycardia signal
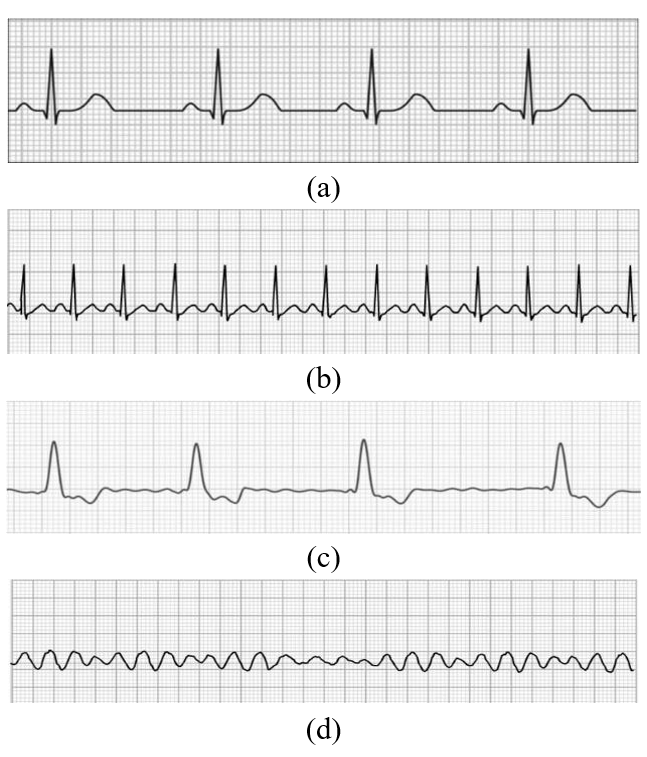
For the bradycardia signal, the same behavior, as the healthy signal, must be followed. However, the distance between each cycle of the signal will be greater. Although, a longer duration of the isoelectric line between the waves T and P will be appreciated (Figure 4a).2.3.3 Tachycardia signal
Tachycardia follows the behavior of the healthy signal. However, its frequency is doubled; so that, two periods of the signal can be seen for each period of the healthy signal (Figure 4b).2.3.4 Atrial fibrillation
For the atrial fibrillation signal, only the QRS complex is maintained. However, the other sections of the signal will be reduced. This can be modeled using random numbers, which will be responsible for representing noise in the signal. Behavior that can be seen in this type of waves. In addition, it seeks to eliminate the characteristic pattern of the normal wave, this because atrial fibrillation is the union of tachycardia and bradycardia (Figure 4c).2.3.5 Ventricular fibrillation
This signal can be modeled by using a single noise signal due to it does not have any type of defined wave (Figure 4d).
Fig. 4. EKG signal with different pathologies (a) Bradycardia. (b) Tachycardia.
(c) Atrial Fibrillation. (d) Ventricular Fibrillation.
(Beta Móvil, 2019
;
Notificaciones de Ritmo irregular y
ECG, qué son y cómo funcionan | Beta Móvil. https://www.betamovil.com/notificaciones-de-ritmo-irregular-y-ecg-que-son-y-como-funcionan/
Jorge, 2017
; Practical Clinical Skills, ECG 7.2 Ritmo
sinusal, arritmias del nodo
sinusal - Cardio Science. https://www.cardioscience.com.mx/nota.php?id=263
, 2020b
, Taquicardia Sinusal Guía de referencia. https://www.practicalclinicalskills.com/ekg-reference-guide-details-es?lessonid=2
,2020a
)Fibrilación
Ventricular Guía de referencia.
https://www.practicalclinicalskills.com/ekg-reference-guide-details-es?lessonid=26
2.4. Electrocardiograph design
The electrocardiograph is an electronic medical instrument that captures and amplifies the electrical impulses of the heart and, as a result, the electrocardiogram (EKG) is obtained
(Material Médico, 2017)
.
Electrocardiógrafo. https://materialmedico.org/electrocardiografo/
2.4.1 Signal attenuation
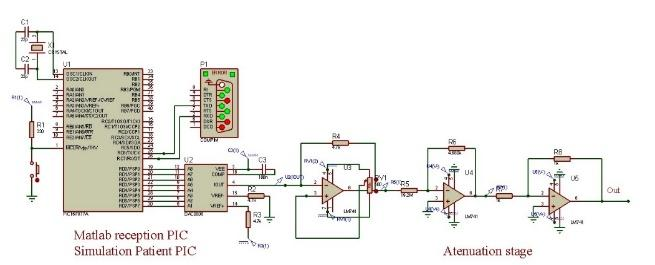
The signal that represents the patient's status is stored in a PIC16F877A, which is received in the DAC as discrete data and thus performs the respective conversion to pass to continuous voltage data. A digital to analog converter (DAC) is used which converts discrete data or sequences into a continuous voltage or current signal. Furthermore, the Nyquist theorem is taken into account to reconstruct the input signal from the sampled data. Knowing that the PIC output signal has a voltage of 5 V, it is necessary to attenuate it to approximately 0.77 mV in order to properly use the instrumentation amplifier and to have a simulation closer to reality.
Fig. 5. PIC patient simulator and attenuator circuit.
Therefore, it is designed a first inverting attenuator with an attenuation factor of 243.75x10⁻⁶, followed by an inverting voltage follower amplifier to obtain the correct shape of the signal. At the output, around 1.18 mV are obtained, a value small enough to be able to take advantage of the instrumentation amplifier (Figure 5). In addition, the attenuated signal had to be given an offset level adjusted by the DAC amplifier to avoid problems with the signal in the later stages of the electrocardiograph.
2.4.2 Instrumentation amplifier
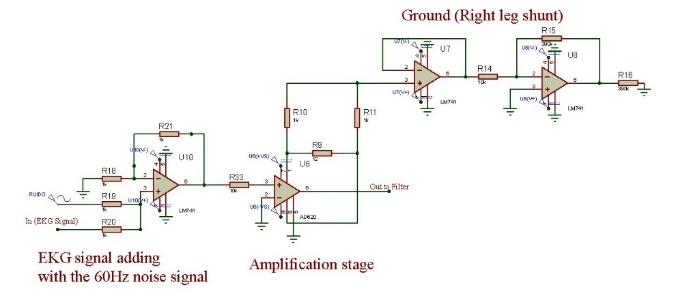
Once the signal has been attenuated, a summing amplifier with a unity gain factor is used which adds the electrocardiographic signal with a 60 Hz sinusoidal signal from the line corresponding to the noise signal. Then, it is coupled with the AD620 amplifier, a high precision instrumentation amplifier that requires only an external resistor to generate gains of 1 to 10,000(Analog Devices, 2011)
. Due to the type of signal used
in an electrocardiogram (approximately 1 mV), it is necessary an amplification with a high differential gain
and a low common mode gain with respect to the differential. This is a high common mode rejection (CMRR),
which is achieved using the AD620 instrumentation amplifier and the “right leg bypass” which, in the case of
simulation, would be connected to ground acting as the lower extremity (leg) of the patient Low-Cost Low Power Instrumentation Amplifier AD620.
(Texas Instruments, 2015)
.
INA129-EP Precision, Low Power
Instrumentation Amplifiers.
In this way, a gain value of approximately 4118 is adjusted to obtain a value close to 5 V at the output. The circuit is as follows:

Fig. 6. Instrumentation amplifier.
2.4.3 Notch filter
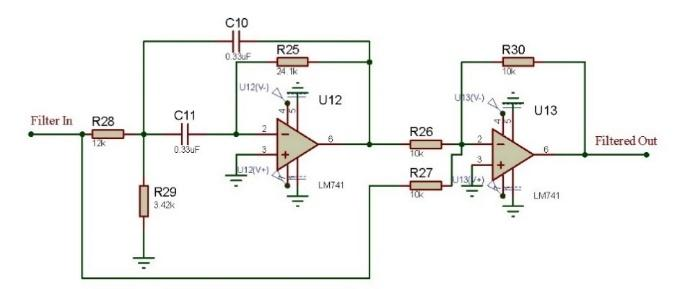
The notch filter is designed to reject the noise value of 60 Hz (Figure 7), which is constructed by subtracting the output of a narrow band pass filter from the input signal; so that, the desirable frequency (the one corresponding to the Resonance frequency of the narrow band pass filter) will be seen in the output attenuated. In other words, the frequencies that are initially in the passband are those that are attenuated at the output. Besides, a summing amplifier is connected to the output of the filter with which the attenuation or depth of the filter notch is adjusted(Sedra & Smith, 2015)
. As mentioned above, a narrow
band pass filter is designed, whose resonance frequency is 60 Hz and, thus, obtains the desired behavior.
For the design, the bandwidth was considered to be 40 Hz. So, the quality factor is approximately 1. By
choosing a 0.33 µF capacitor, the input resistance value is calculated equal to 12 kΩ and the resistance of
resonance equal to 3.42 kΩ. Therefore, the circuit is the following:
Microelectronic Circuits (OXFORD Uni).

Fig. 7. Designed notch filter.
2.4.4 Adjustment amplifier
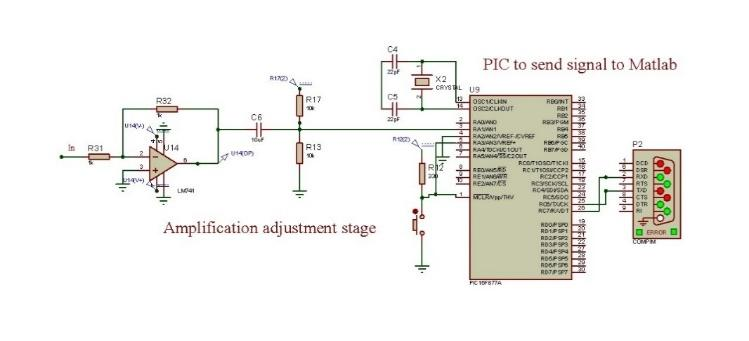
To give a greater amplification to the signal, as a final stage, an inverting follower amplifier is added. For that reason, the output signal has a value of 5 V to take advantage of the conversion window of the microcontroller. Furthermore, while the signal passes through the other stages, an undesired offset is generated. Whereby for this last stage, it is necessary to make an adjustment avoiding the problems generated with the microcontroller. The corresponding circuit is shown below:
Fig. 8. Gain and offset adjustment.
2.5. Sending and acquisition of the signal (PIC serial Matlab)
For the data transmission, the PIC is programmed to send the information through the serial port, setting this process at a rate of 38400 bauds. In the same way, in the Proteus simulator, the “Compim” component is used, which is set to the same baud rate (Figure 8). On the other hand, in the Matlab program, the serial port is initialized. It is adjusted to receive the same number of baud through a For cycle, the values of the signal acquired through the port will be saved, once it has been acquired all of them. It is necessary that, in the signal, non-congruent peaks may be presented, in which, a filtering of the vector that contains the signal is applied in order to obtain a true copy of it.2.6. Digital signal processing
2.6.1 Power Spectral Density (PSD).
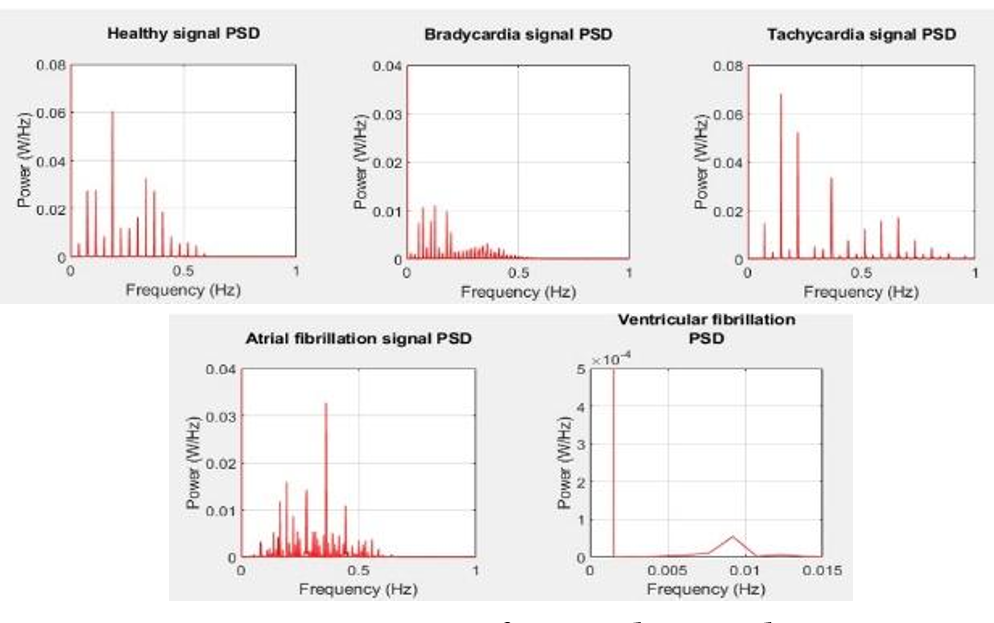
To carry out the diagnostic process of the acquired EKG signal, it is used the Power Spectral Density analysis of the normal EKG signal and of each of the pathologies (Figure 9). In this process, the power distribution of a signal over a frequency interval is determined and calculated using Eq. (1)(Li et al., 2020)
.
\[ P_{xx}(f) = T \sum_{k=-\infty}^{\infty} r_{xx}(k) e^{-j2\pi fkT} \quad -\frac{1}{2T} \leq f \leq
\frac{1}{2T} \hspace{1cm} (1)\]
When the power spectrum is calculated via the Fourier transform and subsequently averaged, it is then known
as a periodogram, which is calculated by dividing the signal into a certain number of segments, possibly
overlapping and evaluating the Fourier transform in each of these segments Signal Detection Based on Power-Spectrum
Sub-Band. https://doi.org/10.3390/electronics10010064
(MATLAB,
2020)
.
Power Spectral Density Estimates Using FFT - MATLAB & Simulink -
MathWorks Deutschland. https://de.mathworks.com/help/signal/ug/power-spectral-density-estimates-using-fft.html

Fig. 9. PSD of stored signals.
To perform the analysis by the method of the PSD, it was necessary to acquire the signal through the process of sending it since Proteus to Matlab. Once it is captured, it is stored in a data vector in which the respective PSD analysis is performed by means of the periogram () function. After this, there are the peaks in which the characteristic frequencies of each spectrum are presented, in such a way that with the findpeaks () command, it is possible to distinguish the differences between the densities for each case.
2.7 Fast Fourier Transform (FFT)
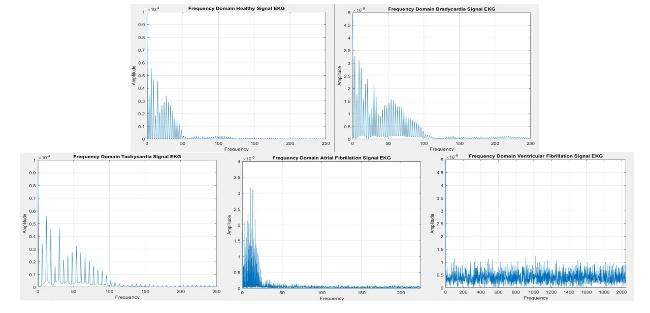
In the information menu, the behavior of the signals in both the time and frequency domain can be seen. The first is acquired directly from the vector with the corresponding signal. However, this signal is not in terms of time. Instead of this, it is in terms samples, therefore, for each signal a time vector of the same number of samples is generated with which it will be plotted. In addition to this, it is generated the grids EKG that have the same values used in a physical EKG sheet. The second, is obtained by using the FFT in Matlab, with this, the frequency values are plotted as shown in Figure 10.
Fig. 10. Analysis of the signals in the frequency domain.
3. RESULTS
3.1 Signal modeling
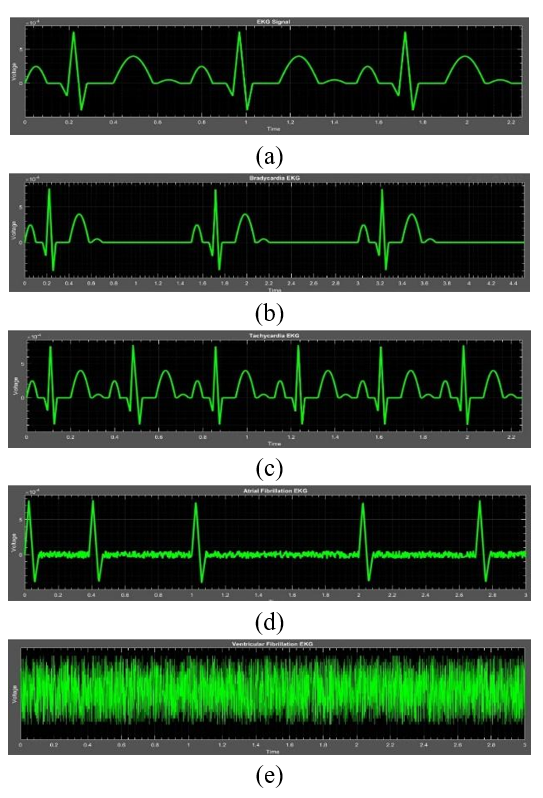
Using the equations in Table 1 and the specifications given for each pathology, the result of the designed signals is shown in Figure 11, where the first three periods of both healthy signal and bradycardia, tachycardia, atrial fibrillation and ventricular fibrillation can be seen. For the bradycardia signal (Figure 11b), a longer duration is observed in the isoelectric line between the T and P waves, with a time of 800 ms, compared to 50 ms of pulse separation in the healthy signal. With respect to the tachycardia signal (Figure 11c), for every 3 periods of the healthy signal, twice as many pulses will be obtained in this pathology, which implies that the duration of the isoelectric line will be shorter, in this case, with a time of 25 ms compared to the signals described above. In the atrial fibrillation signal (Figure 11d), there is no longer an isoelectric line, while only the QRS complex is observed, as corresponds to the characteristic of this type of pathology. Finally, the ventricular fibrillation signal (Figure 11e), in the absence of a defined pattern, is shown as a noise signal.
Fig. 11. Normal EKG signal (a) and with different pathologies (b) Bradycardia.
(c) Tachycardia. (d) Atrial Fibrillation. (e) Ventricular Fibrillation.
3.2 Electrocardiograph
3.2.1 Signal attenuation
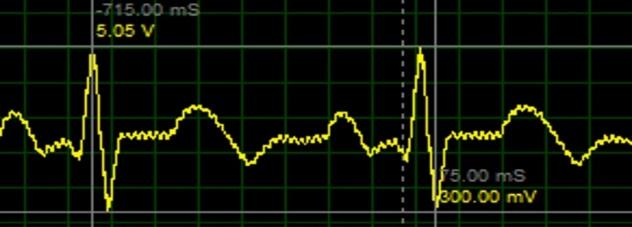
As mentioned, the aim is to attenuate the signal reconstructed by the DAC from 5 V to approximately 1.17 mV. The output is seen in Figure 12, where the reconstructed signal by the DAC (pink) is compared with the signal coming from the attenuator (yellow).
Fig. 12. Reconstruction and attenuation of the healthy signal.
3.2.2 AD620 Instrumentation amplifier.
Once the electrocardiographic signal and the noise signal are added (Figure 13, yellow signal), the resultant signal is passed through the instrumentation amplifier, this one amplifies the signal until approximately 5V (Figure 13, blue signal). Due the signal contains noise, this one will be amplified, too. The corresponding signals are shown below:
Fig. 13. Add and amplification of the healthy signal with noise.
3.2.3 Notch filter and adjust amplifier
By the use of the filter and the offset adjust, it is achieved a significate attenuation of the noise signal, obtaining, finally, the signal acquired by a PIC microcontroller. The processed signal is shown in Figure 14.
Fig. 14. Healthy signal processed.
3.3 Diagnostic
The first of them corresponds to the data sent to change the desired signal in Proteus (Figure 15b) corresponding to the previously mentioned pathologies. There is also a button, which allows the user to return to the main menu and another that redirects to the diagnostic interface to start the signal identification process.The second menu refers to the diagnosis (Figure 15c), where the user can choose the time in which he wants to start the process. In addition, both the incoming signal with its respective spectral density graph and the spectral densities of each of the saved signals are presented. Once the diagnostic process is completed, these graphs will be visible and the patient's diagnosis will be displayed at the bottom. Additionally, in the lower right place there are two buttons, the first one allows the user to return to the main menu, while the second one gives the option to select a new signal.
Finally, the third menu, which corresponds to the Information menu (Figure 15d), presents an aid to visualize time and frequency from each of the signals studied. Besides, there is a button that allows the user to return to the main menu.

Fig. 15. User Interface. (a) Principal menu. (b) Signal sending menu. (c)
Diagnostics menu. (d) information menu.
4. CONCLUSIONS
It was applied the mathematical model of the healthy and pathological signals using slopes, trigonometric equations and also taking into account the signal’s own characteristics. With this, it was possible simulate the different conditions of a patient (normal, bradycardia, tachycardia, auricular fibrillation and ventricular fibrillation).Through the use of operational amplifiers, the design of an electrocardiographic system was achieved. This one can amplify the signals in order to encompass all the conversion window of the microcontroller in charge of the serial communication with the Matlab program, filtering at the same time the 60 Hz noise frequency of the electric supply. In parallel, it was designed a system capable of simulate a real patient heart conditions, by the acquisition of a signal through a microcontroller and reducing its voltage from 5 V to 1.17 mV. This value is concordant with the mathematical model applied in order to design the signals in Matlab.
Through the use of asynchronous serial communication by means of the creation of virtual ports, it was possible to make the connection between programs (Matlab and Proteus), in which it is possible to preset the cardiac characteristics of the patient in Proteus depending on the previous selection requested by the user in Matlab. Likewise, thanks to this communication, it is possible to send the treated signal to Matlab for its later acquisition and diagnosis.
By the use of the software Matlab, when changing from time to frequency domain and comparing the Power Spectral Density of acquired signal by means of the electrographic system and the saved signals in the program, it is possible to give a dictum of the patient’s conditions, through the identification of the minimal error during the comparison process.
An electrographic system was designed. This one is capable of performing a medical dictum of the simulated patient status based on the acquisition of its vital signs and comparing it with five different signals which are saved in the program. All this is made by the use of analogic methods (Proteus software) and digital methods by using Matlab, performing a time and frequency domains analysis.
REFERENCES
Analog Devices. (2011). Low-Cost Low Power Instrumentation Amplifier AD620.Beta Móvil. (2019). Notificaciones de Ritmo irregular y ECG, qué son y cómo funcionan | Beta Móvil. https://www.betamovil.com/notificaciones-de-ritmo-irregular-y-ecg-que-son-y-como-funcionan/
Bistel, R., & Fajardo, A. (2015). Design of a System for Acquisition and Processing ECG´s Signals based on Virtual Instrumentation. RIELAC, 1, 17–30.
Cantillo Maldonado, A., Gualdron Guerrero, O., & Ortiz Sandoval, J. (2018). Signal Processing EMG in an Embedded System for Control Neuronal of a Robotic Arm. Revista Colombiana de Tecnologías de Avanzada, 2(32), 139–147. https://doi.org/10.24054/16927257.v32.n32.2018.3037
García, M. (2015). Procesado de Señales Cardiacas: Análisis de Organización de Fourier. 89.
Jorge, H. V. (2017). ECG 7.2 Ritmo sinusal, arritmias del nodo sinusal - Cardio Science. https://www.cardioscience.com.mx/nota.php?id=263
Li, H., Hu, Y., & Wang, S. (2020). Signal Detection Based on Power-Spectrum Sub-Band. https://doi.org/10.3390/electronics10010064
Marcela, G. V., & Ximena, M. O. (2009). Análisis De Señales Electrocardiográficas (ECG) Con Isquemia Cardiaca Usando Técnicas De Procesamiento Digital De Señales. Aspectos Generales De La Planificación Tributaria En Venezuela, 2009(75), 31–47.
Material Médico. (2017). Electrocardiógrafo. https://materialmedico.org/electrocardiografo/
MATLAB. (2020). Power Spectral Density Estimates Using FFT - MATLAB & Simulink - MathWorks Deutschland. https://de.mathworks.com/help/signal/ug/power-spectral-density-estimates-using-fft.html
Practical Clinical Skills. (2020a). Fibrilación Ventricular Guía de referencia. https://www.practicalclinicalskills.com/ekg-reference-guide-details-es?lessonid=26
Practical Clinical Skills. (2020b). Taquicardia Sinusal Guía de referencia. https://www.practicalclinicalskills.com/ekg-reference-guide-details-es?lessonid=2
Prasad, B. V. P., & Parthasarathy, V. (2018). Detection and classification of cardiovascular abnormalities using FFT based multi-objective genetic algorithm. Biotechnology and Biotechnological Equipment, 32(1), 183–193. https://doi.org/10.1080/13102818.2017.1389303
Ramírez, V., & Dorantes, G. (2017). Probits : Interfaz Gráfica para la Adquisición y Procesamiento de Señales Biomédicas con la Tarjeta Bitalino. Sociedad Mexicana de Ingeniería Biomedica, 282–285.
Rohde & Scjwarz. (2020). Captura de señales de electrocardiogramas pequeñas en aplicaciones médicas | Rohde & Schwarz. https://www.rohde-schwarz.com/es/aplicaciones/captura-de-se-ales-de-electrocardiogramas-peque-as-en-aplicaciones-m-dicas-ficha-de-aplicacion_56279-152385.html?rusprivacypolicy=0
Romero, J. L. (2015). Análisis de Señales Electrocardiográficas usando técnicas de procesamiento digital. Universidad Oberta de Catalunya., 1, 45.
Romo, Á., & Martínez, J. (2019). Diseño De Un Sistema Para El Análisis De Señales Dinámicas Electromiográficas En Estudios De Ergonomía Basado En Técnicas Temporales y Frecuenciales. https://riunet.upv.es/bitstream/handle/10251/159590/51506258N_TFM_15949262307664331268895100267838.pdf?sequence=2
Sedra, A., & Smith, K. (2015). Microelectronic Circuits (OXFORD Uni).
SEMERGEN Cantabria. (n.d.). ECG - valores normales. Retrieved January 19, 2021, from http://www.semergencantabria.org/calc/bmcalc.htm
Siza, R., Cazar, D., & Cortez, M. (2013). Análisis de señales cardiovasculares utilizando técnicas de procesamiento digital de señales. Perfiles, 76.
Texas Instruments. (2015). INA129-EP Precision, Low Power Instrumentation Amplifiers.
Universidad de Pamplona
I. I. D. T. A.
I. I. D. T. A.