Revista Colombiana de
Tecnologías de Avanzada
Tecnologías de Avanzada
Recibido: 15 abril de 2022
Aceptado: 18 agosto de 2022
Aceptado: 18 agosto de 2022
DEPTH MAP SYSTEM FOCUSED ON DISTANCE DETERMINATION
SISTEMA DE MAPA DE PROFUNDIDAD ENFOCADO EN DETERMINACIÓN DE DISTANCIAS
 MSc. Camilo Pardo-Beainy*,
 MSc. Edgar Gutiérrez-Cáceres*.
* Universidad Santo Tomás,Electronic Engineering Faculty.
Tunja, Boyacá Colombia.
Tel.: 57-8-7440404, Ext. 5612.
E-mail: {camilo.pardo, edgar.gutierrez}@usantoto.edu.co
SISTEMA DE MAPA DE PROFUNDIDAD ENFOCADO EN DETERMINACIÓN DE DISTANCIAS
 MSc. Camilo Pardo-Beainy*,
 MSc. Edgar Gutiérrez-Cáceres*.
* Universidad Santo Tomás,Electronic Engineering Faculty.
Tunja, Boyacá Colombia.
Tel.: 57-8-7440404, Ext. 5612.
E-mail: {camilo.pardo, edgar.gutierrez}@usantoto.edu.co
Cómo citar: Pardo-Beainy, C., & Gutiérrez-Cáceres, E. (2022). DEPTH MAP SYSTEM FOCUSED ON
DISTANCE DETERMINATION. REVISTA COLOMBIANA DE TECNOLOGIAS DE AVANZADA (RCTA), 2(40), 30-38. https://doi.org/10.24054/rcta.v2i40.2343
Derechos de autor 2022 Revista Colombiana de Tecnologías de Avanzada (RCTA).
Esta obra está bajo una licencia internacional Creative Commons Atribución-NoComercial 4.0.

Esta obra está bajo una licencia internacional Creative Commons Atribución-NoComercial 4.0.

Abstract: The objective of this work is the Development of a Depth Map Generation System,
oriented to the determination of distances. Where a process of exploration of the methods of Artificial
Vision and Structured Light is performed, to obtain the depth map of a certain scene. By means of this map
it is possible to extract the 3D location data of the objects present in the scene. The work addresses the
problem of 3D distance estimation through the generation of the Depth Map, thus presenting a tool for the
development of future applications, such as classification systems, surface reconstruction, 3D printing and
recognition, among others. The algorithmic development is carried out through Matlab software. It should be
noted that the work focuses specifically on the process of determining distances over a fixed scene under
controlled lighting conditions, and not on light variations of the scene or moving environments. With the
proposed development, the system presents a good response in scenes with depth variations between 540mm to
640mm, presenting errors of less than 5.5% in the mentioned range.
Keywords: Depth maps, structured light, distance measurement, computer vision, computational geometry.
Resumen: Este trabajo tiene como objetivo el Desarrollo de un Sistema de Generación de Mapas de Profundidad, orientado a la determinación de distancias. Donde se realiza un proceso de exploración de los métodos de Visión Artificial y Luz Estructurada, para obtener el mapa de profundidad de una determinada escena. Ya que mediante este mapa se pueden extraer los datos de localización 3D de los objetos presentes en la escena. El trabajo aborda el problema de la estimación de las distancias 3D mediante la generación del Mapa de Profundidad, presentando así una herramienta para el desarrollo de futuras aplicaciones, como sistemas de clasificación, reconstrucción de superficies, impresión y reconocimiento 3D, entre otras. El desarrollo algorítmico se realiza a través del Software Matlab. Cabe destacar que el trabajo se centra específicamente en el proceso de determinación de distancias sobre una escena fija en condiciones de iluminación controlada, y no en variaciones lumínicas de la escena o entornos en movimiento. Con el Desarrollo planteado, el Sistema presenta una buena respuesta en escenas que tienen variaciones de profundidad entre 540mm to 640mm, presentando errores de menos del 5.5% en el rango mencionado.
Palabras clave: Mapas de Profundidad, Luz Estructurada, Medición de Distancia, Visión por Computador, Geometría Computacional.
This project was inspired by research work carried out in the Department of Engineering and Computer Science at Brown University. Which has focused his attention on topics such as Applied Computational Geometry, Computer Graphics, 3D Modeling, and Computer Vision (
In the same way, this Project provides as a means of consultation for future implementations of 3D scanning systems using structured light, presenting the first steps to begin creating distance sensor devices from image acquisition, which may be used in future projects with applications for reconstruction of three-dimensional scenes.
The goal of this work is the Development of a Depth Map Generation System, aimed at distance determination purposes. Where a process of exploration of the methods of Artificial Vision and Structured Light is carried out, in order to be able to obtain the depth map of a certain scene. Since, by means of this map, the 3D location data of the objects present in the scene can be extracted. The work focuses on the problem of estimating 3D distances by generating a Depth Map of a scene. Presenting in this way a tool for the development of future applications, such as classification systems
The present project proposes as a scope the Implementation of a Depth Map Generation System, oriented to the purposes of determining distances, through the use of the structured light technique. The algorithmic development is carried out using the Matlab Software. It should be noted that the work specifically focuses on the process of determining distances on a fixed scene under controlled lighting conditions, and not on light variations in the scene or the environment or moving environments.
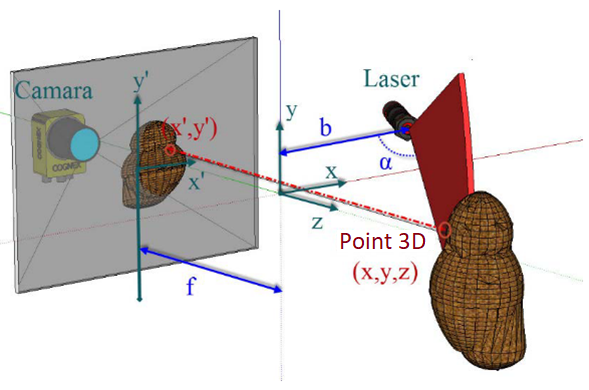
Sensors based on structured light are based on three elements: a light pattern, a detector or camera system, and a processing system. The light source is responsible for emitting a light pattern on the object to be scanned, which will cause a deformation in the pattern that will later be measured by a camera
To calculate the intersection of a line and a plane, the line is represented in parametric form (1): \[ L = \{ p = q_L + \lambda v ; \ \lambda \in \mathbb{R} \} \hspace{1cm} (1)\] \[ P = \{ p \, | \, n^t (p - q_P) = 0 \} \hspace{1cm} (2)\] If the line and the plane did not cross, it could be said that they are parallel. This is the case if the vectors v and n are orthogonal, that is, if \(n^t v = 0 \). The vectors v and n are also orthogonal when the line L is contained in the plane P. Neither of these two conditions would be applicable to the structured light system proposed in this work.
If the vectors v and n are not orthogonal, that is if \( n^t v \neq 0 \), then the intersection of the line and the plane contains exactly one-point p. Since this point belongs to the line, it can be written as \( p = q_L + \lambda v \), for a value \(\lambda\) that would need to be determined. Since the point also belongs to the plane, the value \(\lambda\) must satisfy the linear equation (3): \[ n^t (p - q_P) = n^t (q_L + \lambda v - q_P) = 0 \hspace{1cm} (3)\] And when solving for \(\lambda\) we have (4): \[ \lambda = \frac{{n^t (q_P - q_L)}}{{n^t v}} \hspace{1cm} (4)\] A geometric interpretation of the line-plane intersection is presented in Fig. 2.
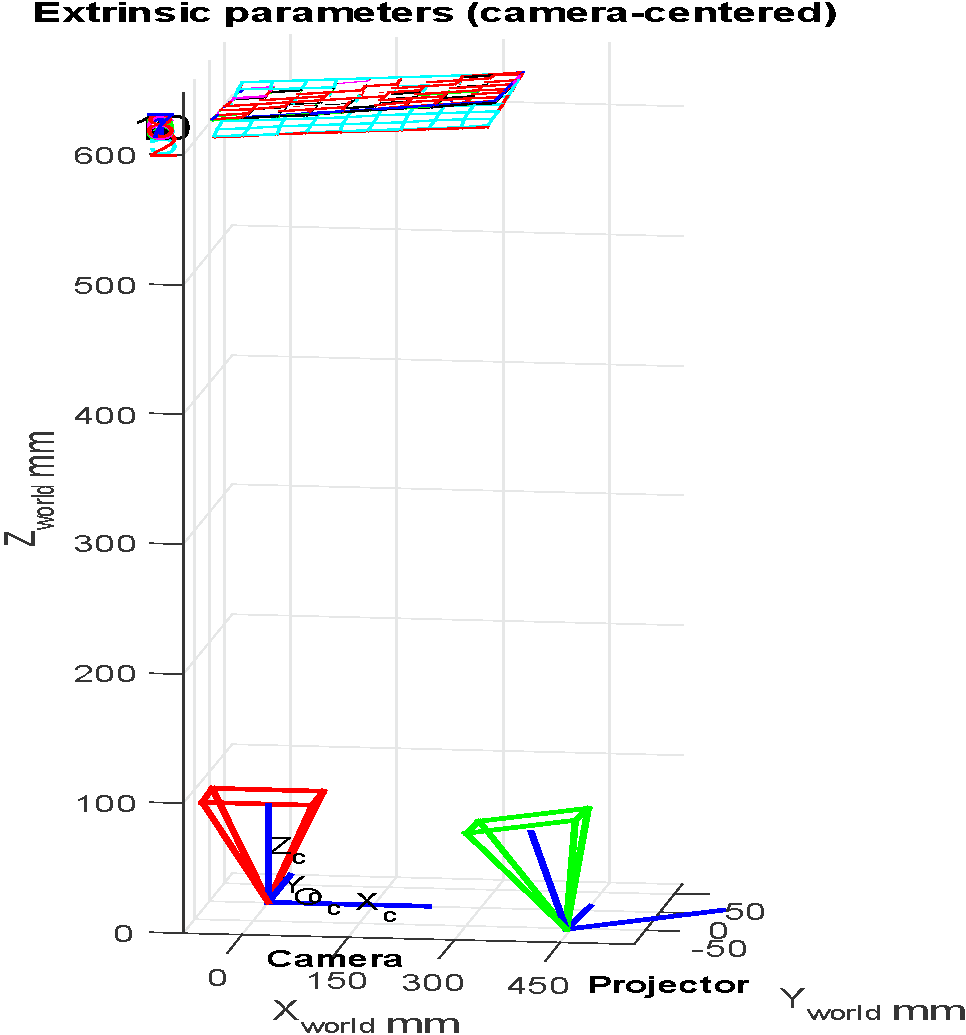
After performing the camera calibration process, the extrinsic and intrinsic parameters of the camera are obtained, which will be loaded to continue with the projector calibration process. The results of the calibration are recorded in a file called calib_cam_proj.mat, which is called from the Matlab program to take these parameters into account in its execution. Likewise, to observe the calibration parameters, a graph is presented with the extrinsic components of the calibration, in a plane that includes the camera and the projector. In this graph, the extrinsic components of the calibration can be visually verified and compared to the actual configuration.
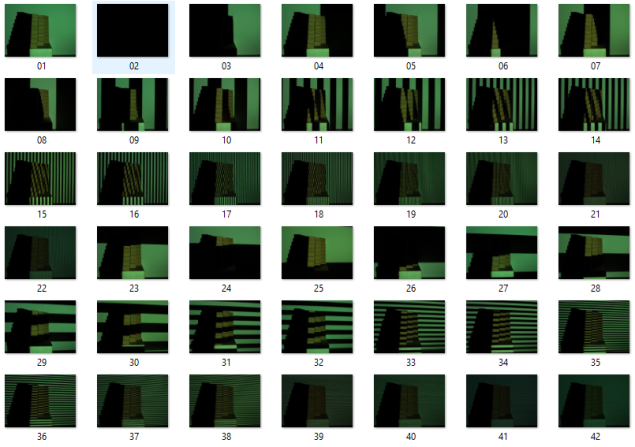
For the system tests, a sequence of 42 pattern images was generated following a gray code in the stripes projected on the selected scene. In this way, for each of the tests carried out, 42 images were acquired for subsequent processing. Each one of the images was stored in .BMP bitmap format and has a resolution of 1600 x1200 pixels and a size of 5.49MB. Fig 7 shows the images acquired with structured light sequence in gray code.
Likewise, and according to the data presented, a graph was made showing the percentage of error for each of the samples taken. In Fig. 12, this error is shown in gray, which, according to the measurement scale on the right side of the graph, reaches its minimum point (0%) in stair Ea1 and its maximum point (11.7%) in the measurement made at the point corresponding to wall P. It can also be seen that there is a gradual increase in the error that corresponds to a second-order polynomial trend curve, as the depth is greater, and that the error is it maintains less than 5% in the range from 540mm to 630mm.
With the above table, it can be seen that the total time invested for the execution of the system is approximately 41,8109 seconds.
The same procedure was developed considering all the stairs taken in the scene. The results are presented in table 3 and in this case the value of the test is less than that defined for alpha, which implies a difference that becomes significant between the values taken with the two measuring instruments.
It can be concluded that the system presents a good response to scenes that have depth variations between 540mm to 640mm, presenting errors of less than 5.5% in the mentioned range. This error is gradual, corresponding to a second order polynomial trend curve, as the depth is greater.
The development of distance determination systems through depth maps presents a much more complete data alternative than that found when making measurements with single point digital laser measurement systems, since it allows generating more information on the various depths at multiple coordinate points in the scene.
It could be seen that the shadows generated by the scene itself generate areas where the bands of coded structured light cannot be interpreted. For this reason, wrong depth measurements can be generated over the shadow area.
The total processing time of the system is close to 42 seconds, investing a time close to 35 seconds in the process of generation and acquisition of sequences.
Andaló, F. A., Taubin, G., & Goldenstein, S. (2015). Efficient height measurements in single images based on the detection of vanishing points. Computer Vision and Image Understanding, 138, 51–60. https://doi.org/10.1016/j.cviu.2015.03.017
Avendano, J., Ramos, P. J. J., & Prieto, F. A. A. (2017). A system for classifying vegetative structures on coffee branches based on videos recorded in the field by a mobile device. Expert Systems with Applications, 88, 178–192. https://doi.org/10.1016/j.eswa.2017.06.044
Bouguet, J.-Y. (n.d.). Camera Calibration Toolbox for Matlab. Retrieved October 4, 2018, from http://www.vision.caltech.edu/bouguetj/calib_doc/
Falcao, G., Hurtos, N., & Massich, J. (2008). Plane-based calibration of a projector-camera system.
Godin, G., Hébert, P., Masuda, T., & Taubin, G. (n.d.). Special issue on new advances in 3D imaging and modeling. Computer Vision and Image Understanding, 113, 1105–1106. https://doi.org/10.1016/j.cviu.2009.09.007
Herrero-Huerta, M., González-Aguilera, D., Rodriguez-Gonzalvez, P., & Hernández-López, D. (2015). Vineyard yield estimation by automatic 3D bunch modelling in field conditions. Computers and Electronics in Agriculture, 110, 17–26. https://doi.org/10.1016/j.compag.2014.10.003
Ivorra Martínez, E. (2015). Desarrollo de técnicas de visión hiperespectral y tridimensional para el sector agroalimentario. Universidad Politécnica de Valencia.
Lanman, D., Crispell, D., & Taubin, G. (2009). Surround structured lighting: 3-D scanning with orthographic illumination. Computer Vision and Image Understanding, 113, 1107–1117. https://doi.org/10.1016/j.cviu.2009.03.016
Lanman, D., & Taubin, G. (2009). Build Your Own 3D Scanner : 3D Photography for Beginners. Siggraph, 94. https://doi.org/10.1145/1665817.1665819
Maurice, X., Graebling, P., & Doignon, C. (2011). Epipolar Based Structured Light Pattern Design for 3-D Reconstruction of Moving Surfaces. IEEE International Conference on Robotics and Automation Shanghai International Conference Center May 9-13, 2011, Shanghai, China, 5301–5308.
Mera, C., Orozco-Alzate, M., Branch, J., & Mery, D. (2016). Automatic visual inspection: An approach with multi-instance learning. Computers in Industry, 83, 46–54. https://doi.org/10.1016/j.compind.2016.09.002
Montalto, A., Graziosi, S., Bordegoni, M., & Di Landro, L. (2016). An inspection system to master dimensional and technological variability of fashion-related products: A case study in the eyewear industry. https://doi.org/10.1016/j.compind.2016.09.007
Oh, J., Lee, C., Lee, S., Jung, S., Kim, D., & Lee, S. (2010). Development of a Structured-light Sensor Based Bin-Picking System Using ICP Algorithm. International Conference on Control, Automation and Systems 2010, Oct. 27-30, 2010 in Kintex, Gyeonggi-Do, Korea, 1673–1677.
Pardo-Beainy, C., Gutiérrez-Cáceres, E., Pardo, D., Medina, M., & Jiménez, F. (2020). Sistema de Interacción con Kinect Aplicado a Manipulación de Procesos. Revista Colombiana de Tecnologías de Avanzada (RCTA), Ed. Especial, 11–16. https://doi.org/10.24054/16927257.VESPECIAL.NESPECIAL.2020.849
Parmehr, E. G., Fraser, C. S., Zhang, C., & Leach, J. (2014). Automatic registration of optical imagery with 3D LiDAR data using statistical similarity. ISPRS Journal of Photogrammetry and Remote Sensing, 88, 28–40. https://doi.org/10.1016/j.isprsjprs.2013.11.015
Saiz Muñoz, M. (2010). Reconstrucción Tridimensional Mediante Visión Estéreo y Técnicas de Optimización. Universidad Pontificia Comillas.
Verdú, S., Ivorra, E., Sánchez, A. J., Girón, J., Barat, J. M., & Grau, R. (2013). Comparison of TOF and SL techniques for in-line measurement of food item volume using animal and vegetable tissues. Food Control, 33(1), 221–226.
Young, M., Beeson, E., Davis, J., Rusinkiewicz, S., & Ramamoorthi, R. (2007). Viewpoint-Coded Structured Light. 2007 IEEE Conference on Computer Vision and Pattern Recognition, 1–8. https://doi.org/10.1109/CVPR.2007.383292
Zeng, Q., Martin, R. R., Wang, L., Quinn, J. A., Sun, Y., & Tu, C. (2014). Region-based bas-relief generation from a single image. Graphical Models, 76, 140–151. https://doi.org/10.1016/j.gmod.2013.10.001
Zhao, Y., & Taubin, G. (2011). Chapter 31 - Real-Time Stereo on GPGPU Using Progressive Multiresolution Adaptive Windows. GPU Computing Gems, 473–495. https://doi.org/10.1016/B978-0-12-384988-5.00031-0
Keywords: Depth maps, structured light, distance measurement, computer vision, computational geometry.
Resumen: Este trabajo tiene como objetivo el Desarrollo de un Sistema de Generación de Mapas de Profundidad, orientado a la determinación de distancias. Donde se realiza un proceso de exploración de los métodos de Visión Artificial y Luz Estructurada, para obtener el mapa de profundidad de una determinada escena. Ya que mediante este mapa se pueden extraer los datos de localización 3D de los objetos presentes en la escena. El trabajo aborda el problema de la estimación de las distancias 3D mediante la generación del Mapa de Profundidad, presentando así una herramienta para el desarrollo de futuras aplicaciones, como sistemas de clasificación, reconstrucción de superficies, impresión y reconocimiento 3D, entre otras. El desarrollo algorítmico se realiza a través del Software Matlab. Cabe destacar que el trabajo se centra específicamente en el proceso de determinación de distancias sobre una escena fija en condiciones de iluminación controlada, y no en variaciones lumínicas de la escena o entornos en movimiento. Con el Desarrollo planteado, el Sistema presenta una buena respuesta en escenas que tienen variaciones de profundidad entre 540mm to 640mm, presentando errores de menos del 5.5% en el rango mencionado.
Palabras clave: Mapas de Profundidad, Luz Estructurada, Medición de Distancia, Visión por Computador, Geometría Computacional.
1. INTRODUCTION
In the last decade, great strides have been made in capturing the three-dimensional structure of real scenes or objects (Andaló et al., 2015;
Efficient height measurements
in single
images based on the detection of vanishing points. Computer Vision and Image Understanding, 138,
51–60. https://doi.org/10.1016/j.cviu.2015.03.017.
Avendano et al., 2017;
A system for classifying vegetative
structures on coffee branches based on videos recorded in the field by a mobile device. Expert
Systems with Applications, 88, 178–192. https://doi.org/10.1016/j.eswa.2017.06.044.
Herrero-Huerta et al., 2015;
Vineyard yield estimation by
automatic 3D bunch modelling in field conditions. Computers and Electronics in Agriculture, 110,
17–26. https://doi.org/10.1016/j.compag.2014.10.003.
Lanman et al., 2009
). Growing computational capabilities make it possible today to process previously intractable volumes
of data,
improving techniques and making them faster and more accurate. This ability to model real world scenes on a
computer is very advantageous in areas such as industry Surround structured lighting: 3-D
scanning with orthographic illumination. Computer Vision and Image Understanding, 113, 1107–1117. https://doi.org/10.1016/j.cviu.2009.03.016.
(Mera et al., 2016)
, industrial design
Automatic visual inspection: An approach with multi-instance learning.
Computers in Industry, 83, 46–54. https://doi.org/10.1016/j.compind.2016.09.002.
(Montalto et al., 2016)
or graphic arts An inspection system to master
dimensional and technological variability of fashion-related products: A case study in the eyewear
industry. https://doi.org/10.1016/j.compind.2016.09.007.
(Zeng et al., 2014)
. 3D reconstruction techniques are an essential tool in all
those disciplines in which the recovery of the three-dimensional structure of a scene is necessary. For this
reason, numerous reconstruction methods have been developed in recent years, including the structured light
technique Region-based
bas-relief generation from a single image. Graphical Models, 76, 140–151. https://doi.org/10.1016/j.gmod.2013.10.001.
(Pardo-Beainy et al., 2020)
, laser telemetry Sistema de Interacción
con Kinect Aplicado a Manipulación de Procesos. Revista Colombiana de Tecnologías de Avanzada
(RCTA), Ed. Especial, 11–16. https://doi.org/10.24054/16927257.VESPECIAL.NESPECIAL.2020.849.
(Parmehr et al., 2014)
, reconstruction by moving
camera Automatic
registration of optical imagery with 3D LiDAR data using statistical similarity. ISPRS Journal of
Photogrammetry and Remote Sensing, 88, 28–40. https://doi.org/10.1016/j.isprsjprs.2013.11.015.
(Avendano et al., 2017)
or the multiview vision technique, where the stereoscopic vision or
three-dimensional reconstruction of a scene is found from at least two 2D views, or stereo of the same A system for classifying
vegetative structures on coffee branches based on videos recorded in the field by a mobile device.
Expert Systems with Applications, 88, 178–192. https://doi.org/10.1016/j.eswa.2017.06.044.
(Saiz Muñoz, 2010)
.
Reconstrucción Tridimensional Mediante
Visión Estéreo y Técnicas de Optimización. Universidad Pontificia Comillas.
This project was inspired by research work carried out in the Department of Engineering and Computer Science at Brown University. Which has focused his attention on topics such as Applied Computational Geometry, Computer Graphics, 3D Modeling, and Computer Vision (
Akleman et al., 2015
; Special Section on Expressive Graphics Hamiltonian cycle art: Surface covering
wire sculptures and duotone surfaces. Computers and Graphics, 37, 316–332. https://doi.org/10.1016/j.cag.2013.01.004.
Andaló et al., 2015
; Efficient height measurements in
single images based on the detection of vanishing points. Computer Vision and Image Understanding,
138, 51–60. https://doi.org/10.1016/j.cviu.2015.03.017.
Godin et al., n.d.
; Special issue on new advances in
3D imaging and modeling. Computer Vision and Image Understanding, 113, 1105–1106. https://doi.org/10.1016/j.cviu.2009.09.007.
Lanman et al., 2009
; Surround structured lighting:
3-D scanning with orthographic illumination. Computer Vision and Image Understanding, 113,
1107–1117. https://doi.org/10.1016/j.cviu.2009.03.016.
Lanman & Taubin, 2009
;
Build Your Own 3D Scanner : 3D
Photography for Beginners. Siggraph, 94. https://doi.org/10.1145/1665817.1665819.
Zhao & Taubin, 2011
).
Chapter 31 - Real-Time Stereo on GPGPU
Using Progressive Multiresolution Adaptive Windows. GPU Computing Gems, 473–495. https://doi.org/10.1016/B978-0-12-384988-5.00031-0.
In the same way, this Project provides as a means of consultation for future implementations of 3D scanning systems using structured light, presenting the first steps to begin creating distance sensor devices from image acquisition, which may be used in future projects with applications for reconstruction of three-dimensional scenes.
The goal of this work is the Development of a Depth Map Generation System, aimed at distance determination purposes. Where a process of exploration of the methods of Artificial Vision and Structured Light is carried out, in order to be able to obtain the depth map of a certain scene. Since, by means of this map, the 3D location data of the objects present in the scene can be extracted. The work focuses on the problem of estimating 3D distances by generating a Depth Map of a scene. Presenting in this way a tool for the development of future applications, such as classification systems
(Oh et al., 2010)
, surface reconstruction
Development of a Structured-light Sensor Based Bin-Picking System Using ICP
Algorithm.
(Maurice et al., 2011)
, 3D recognition and printing Epipolar Based Structured Light Pattern
Design for 3-D Reconstruction of Moving Surfaces.
(Young et al., 2007)
, among other.
Viewpoint-Coded Structured Light. 2007 IEEE Conference on Computer Vision and Pattern Recognition,
1–8. https://doi.org/10.1109/CVPR.2007.383292.
The present project proposes as a scope the Implementation of a Depth Map Generation System, oriented to the purposes of determining distances, through the use of the structured light technique. The algorithmic development is carried out using the Matlab Software. It should be noted that the work specifically focuses on the process of determining distances on a fixed scene under controlled lighting conditions, and not on light variations in the scene or the environment or moving environments.
2. MATERIALS AND METHODS
2.1 Structured Light
The structured light technique is based on the relationship between a camera and a light source, which projects a known pattern on the scene to be scanned. With this pattern, only the points illuminated by the light source are captured by a camera, which will be in sync with the light emitting source. By matching the captured image to the original pattern, it is possible to triangulate the position of each pixel and determine its depth with respect to the plane perpendicular to the camera. In this way, the camera will capture the deformations of the patterns emitted by the light source (Projector).Sensors based on structured light are based on three elements: a light pattern, a detector or camera system, and a processing system. The light source is responsible for emitting a light pattern on the object to be scanned, which will cause a deformation in the pattern that will later be measured by a camera
(Verdú et al., 2013)
. The 3D information comes from the deformation of this pattern based on trigonometric functions
Comparison of TOF and SL techniques for
in-line measurement of food item volume using animal and vegetable tissues. Food Control, 33(1),
221–226.
(Godin et al., n.d.)
.
Fig. 1. presents a general diagram of a 3D capture system based on structured light.
Special issue on new advances in 3D
imaging and modeling. Computer Vision and Image Understanding, 113, 1105–1106. https://doi.org/10.1016/j.cviu.2009.09.007.

Fig. 1. Scheme of a 3D capture system based on structured light
(Ivorra Martínez, 2015)
Desarrollo de técnicas de visión
hiperespectral y tridimensional para el sector agroalimentario. Universidad Politécnica de
Valencia.
2.2 Line-Plane Intersection
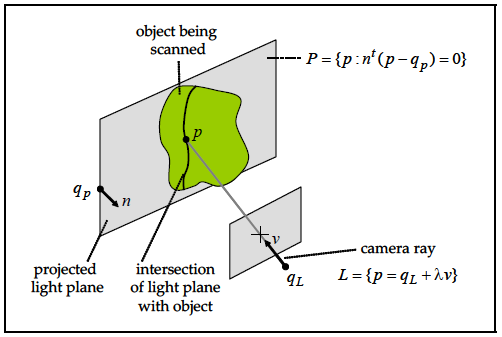
A projected line creates a light plane, the intersection of a light plane with the object, usually containing many illuminated curved segments. Each of these segments is made up of many illuminated dots. A single illuminated point, visible to the camera, defines a camera beam. The equations of the projected planes, as well as the equations of the camera rays corresponding to the illuminated points, are defined by parameters that can be measured. From these measurements, the location of the illuminated points can be recovered by intersecting the planes or rays of light with the camera rays corresponding to the illuminated points. In this way, the recovery of a 3D surface model is allowed(Lanman & Taubin,
2009)
.
Build Your Own 3D Scanner : 3D Photography for Beginners. Siggraph, 94.
https://doi.org/10.1145/1665817.1665819.
To calculate the intersection of a line and a plane, the line is represented in parametric form (1): \[ L = \{ p = q_L + \lambda v ; \ \lambda \in \mathbb{R} \} \hspace{1cm} (1)\] \[ P = \{ p \, | \, n^t (p - q_P) = 0 \} \hspace{1cm} (2)\] If the line and the plane did not cross, it could be said that they are parallel. This is the case if the vectors v and n are orthogonal, that is, if \(n^t v = 0 \). The vectors v and n are also orthogonal when the line L is contained in the plane P. Neither of these two conditions would be applicable to the structured light system proposed in this work.
If the vectors v and n are not orthogonal, that is if \( n^t v \neq 0 \), then the intersection of the line and the plane contains exactly one-point p. Since this point belongs to the line, it can be written as \( p = q_L + \lambda v \), for a value \(\lambda\) that would need to be determined. Since the point also belongs to the plane, the value \(\lambda\) must satisfy the linear equation (3): \[ n^t (p - q_P) = n^t (q_L + \lambda v - q_P) = 0 \hspace{1cm} (3)\] And when solving for \(\lambda\) we have (4): \[ \lambda = \frac{{n^t (q_P - q_L)}}{{n^t v}} \hspace{1cm} (4)\] A geometric interpretation of the line-plane intersection is presented in Fig. 2.

Fig. 2. Triangulation principle by Line-Plane intersection
(Lanman & Taubin, 2009)
Build Your Own 3D Scanner : 3D
Photography for Beginners. Siggraph, 94. https://doi.org/10.1145/1665817.1665819.
2.3 General Perspective
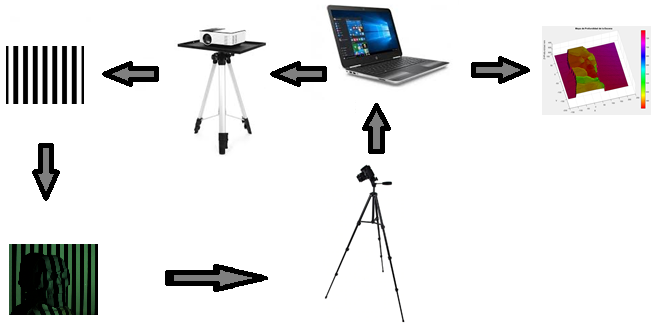
Fig. 3 presents the general scheme of the proposed system. In this scheme, the central part is composed of a computer that has the Matlab R2018a software installed, and it is through this software that the execution of the system is developed, and that the user can appreciate the depth map finally generated in the reconstruction process. To the computer equipment, a projector and a camera are connected, responsible for the emission and acquisition respectively, of each of the considered patterns. These teams are each located on a tripod and oriented towards the scene to be scanned.
Fig. 3. General Scheme of the System
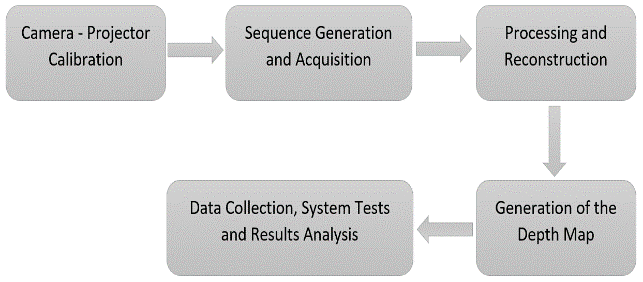
The structured light scanning system can be explained from the block diagram of Fig. 4.

Fig. 4. General Block Diagram of the System
Each of these stages are presented below:
-
Camera - Projector Calibration: A flat checkerboard calibration method is used to minimize the
complexity and cost of calibration (Falcao et al., 2008). This method is based on considering the projector as a reverse camera, assigning 2D image intensities in 3D rays, so the calibration of a projector is the same as that of a camera. In this way, the system can be calibrated using a standard camera calibration method as implemented in the Bouguet calibration toolbox.Plane-based calibration of a projector-camera system.(Bouguet, n.d.).Camera Calibration Toolbox for Matlab. Retrieved October 4, 2018, from http://www.vision.caltech.edu/bouguetj/calib_doc/.
- Sequence Generation and Acquisition: In this stage a set of 42 structured light patterns is generated, using Gray coding; as these patterns are projected, an acquisition process is developed for their subsequent processing.
- Processing and Reconstruction: With the images from the acquisition system, the necessary processing is carried out to reconstruct a 3D point cloud, through triangulation. In this way, the depth map of the scene is generated.
- Generation of the Depth Map: With the point cloud of the reconstructed scene, the depth map of the scene is obtained, thus determining the separation distance that may exist between the acquisition device (camera) and a determined object being scanned.
- Data Collection, System Tests and Results Analysis: Once the implementation has been carried out, the behavior of the system is verified through data collection, system tests and analysis of the results obtained. As a result of this stage, the advantages and disadvantages of the implemented system can be concluded and future works that complement the proposed development can be proposed.

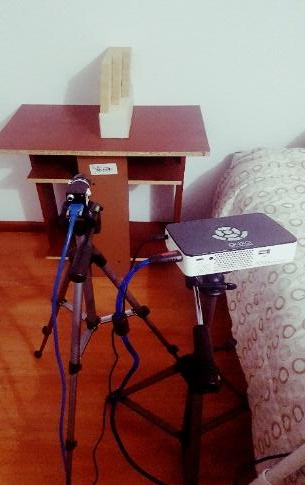
Fig. 5. Photograph of the placement of the Camera and Projector
3. RESULTS
3.1 Calibration Results
In this work, the method implemented for the calibration of the camera-projector system(Falcao et al., 2008)
, is an extension of the method proposed by Bouguet in Matlab's camera calibration toolbox
Plane-based calibration of a
projector-camera system.
(Bouguet, n.d.)
. As a first step in the development process, the images were acquired with the camera. For this, a
sequential image acquisition and storage program developed from Matlab was generated.
Camera Calibration Toolbox for Matlab.
Retrieved October 4, 2018, from http://www.vision.caltech.edu/bouguetj/calib_doc/.
After performing the camera calibration process, the extrinsic and intrinsic parameters of the camera are obtained, which will be loaded to continue with the projector calibration process. The results of the calibration are recorded in a file called calib_cam_proj.mat, which is called from the Matlab program to take these parameters into account in its execution. Likewise, to observe the calibration parameters, a graph is presented with the extrinsic components of the calibration, in a plane that includes the camera and the projector. In this graph, the extrinsic components of the calibration can be visually verified and compared to the actual configuration.

Fig. 6. Extrinsic parameters of the camera-projector calibration
3.2 Results of the generation and acquisition of sequences
As a test sequence, a set of blocks stacked in three stairs is used, which increase in depth as their levels increase; In total, there are 24 stairs that are stacked on a common base in three blocks of 8 stairs each, the stairs on the left being the ones closest to the camera and those on the right the furthest.For the system tests, a sequence of 42 pattern images was generated following a gray code in the stripes projected on the selected scene. In this way, for each of the tests carried out, 42 images were acquired for subsequent processing. Each one of the images was stored in .BMP bitmap format and has a resolution of 1600 x1200 pixels and a size of 5.49MB. Fig 7 shows the images acquired with structured light sequence in gray code.

Fig. 7. Images Acquired with Structured Light Sequence in Gray Code
3.3 Processing and Reconstruction Results
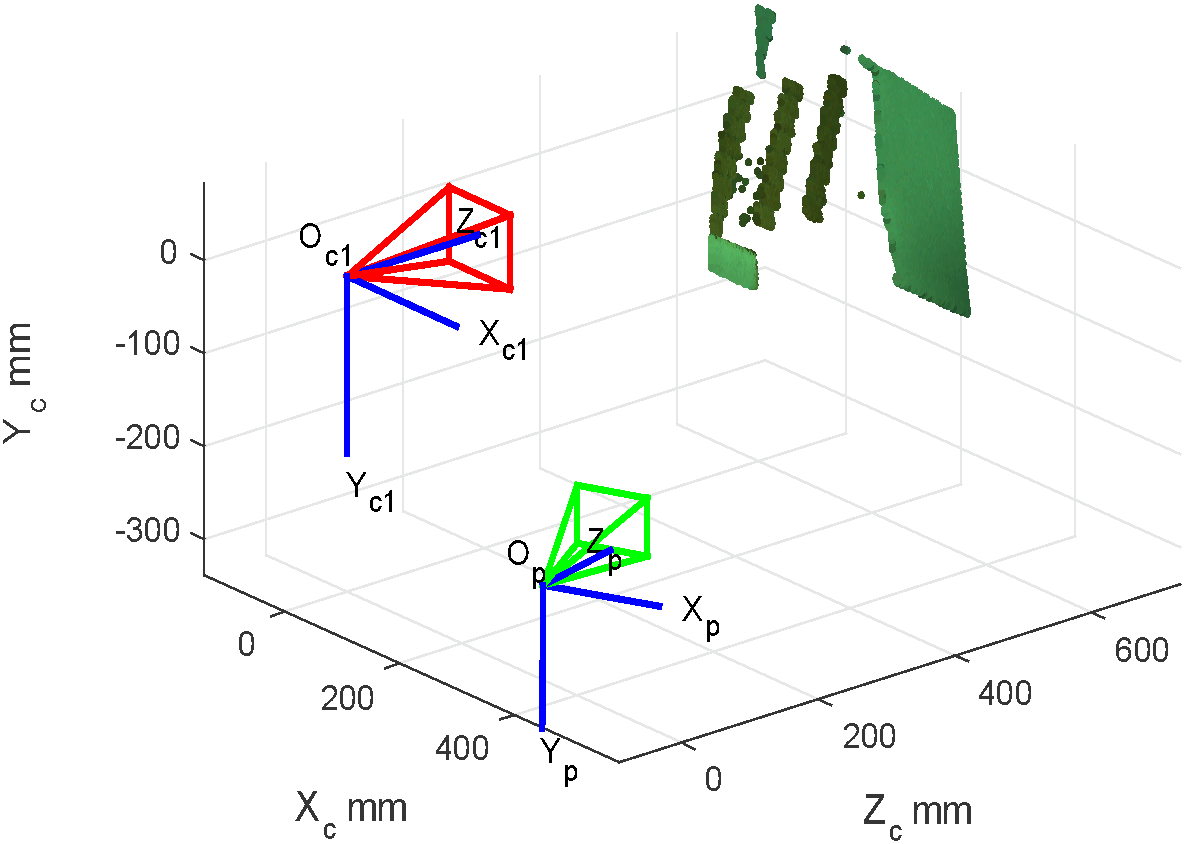
Decoded correspondences are used to reconstruct a 3D point cloud of the scene, taking as a texture reference the first image acquired with a projected white pattern. By reconstructing the scene of stairs, the results presented below are obtained in a point cloud in an X, Y, Z plane. In Fig. 8, the distribution of the point cloud is shown taking the Z axis as the axis of depth in millimeters. The image presents the scene including the camera (represented in red) and the projector (represented in green).
Fig. 8. 3D reconstruction through a decoded point cloud of the scene
3.4 Results of the Depth Map Generation
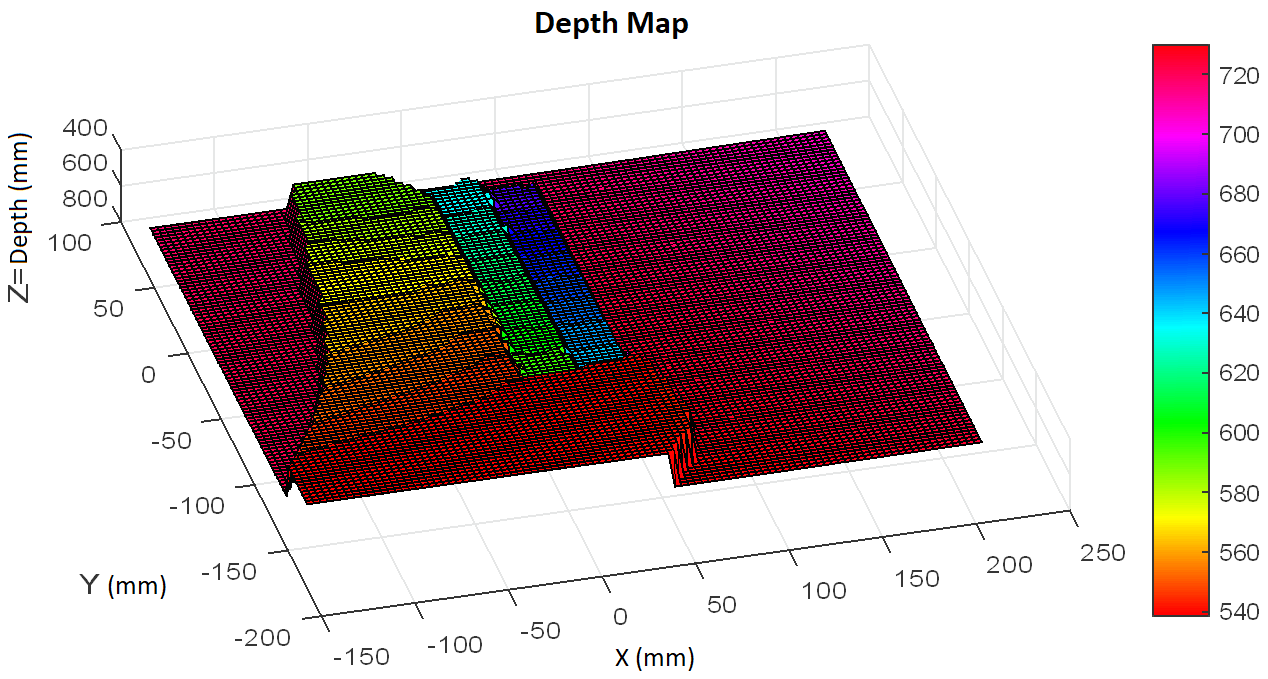
From the correspondence values of the previously presented point clouds, the depth map of the treated scenes was generated. For this, the coordinates of each of the points in X, Y, Z were taken, where Z represents the depth in millimeters of each point in the scene under consideration. Fig. 9, shows the depth map of the Stairs scene, where an equivalence of depth is proposed, associated with a map of color intensities of 100 rows per 100 columns of data and an interpolation with the closest values is proposed, to appreciate a more uniform behavior on the depth map.
Fig. 9. Depth Map of Stairs Scene
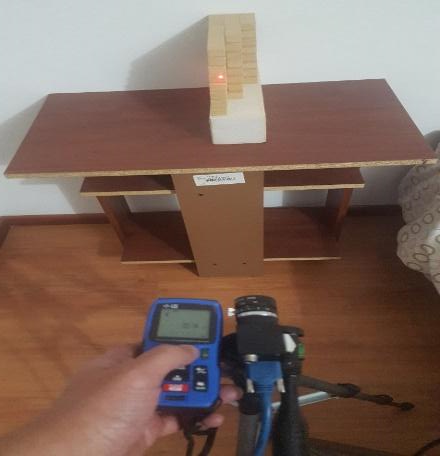
To validate the data produced by the developed system, measurements of the scene were taken with a digital
laser distance meter from the manufacturer Mileseey Technology, which has a measurement precision of +/-
1.5mm. Measurements were made of the distance from the camera to each of the stairs in the scene, to make
comparisons of its behavior, with respect to a set of reference data from another measurement instrument.
Fig. 10 shows the validation procedure developed.

Fig. 10. Validation of depth with a digital laser distance meter
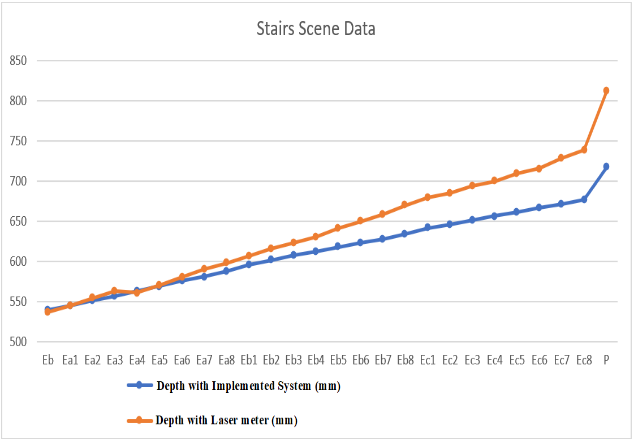
In total, 26 measurement points were taken, equivalent to the common base (Eb), the stairs of each of the
columns ((Left column (Ea1 - Ea8)), (Central column (Eb1 - Eb8)) and (Column right (Ec1 - Ec8))) and the
distance to the wall (P). With these measurements, a graph was developed that shows the behavior of each of
the measurements. In Fig. 11 the results of the structured light measurement system can be seen in blue and
in orange, the results obtained with the laser meter.
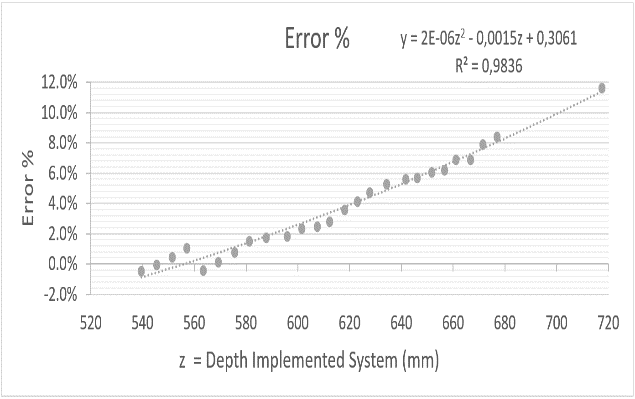
Likewise, and according to the data presented, a graph was made showing the percentage of error for each of the samples taken. In Fig. 12, this error is shown in gray, which, according to the measurement scale on the right side of the graph, reaches its minimum point (0%) in stair Ea1 and its maximum point (11.7%) in the measurement made at the point corresponding to wall P. It can also be seen that there is a gradual increase in the error that corresponds to a second-order polynomial trend curve, as the depth is greater, and that the error is it maintains less than 5% in the range from 540mm to 630mm.

Fig. 11. Depth Measurement Data with the Structured Light system and the Laser
meter on the Stairs scene

Fig. 12. Error % for each data
3.5 Compute Time
The computational performance of the system is verified through the time invested in the execution of each of its stages. The execution times of each stage were measured with the Matlab commands “tic” (at the beginning of each section) and “toc” (at the end of each section), giving the results presented in table 1.Table 1: Measured Time for the Execution of the System
| Stage | Measured time for the execution of the Stage |
|---|---|
| Camera Settings | 0,2976 seconds |
| Generation and Acquisition of a single Structured Light sequence | 0,7673 seconds |
| Generation and Acquisition of the 42 Structured Light sequences | 35,1516 seconds |
| Processing and Reconstruction Stage | 5,0931 seconds |
| Depth Map Generation Stage | 0,1412 seconds |
| Full System Execution | 41,8109 seconds |
With the above table, it can be seen that the total time invested for the execution of the system is approximately 41,8109 seconds.
3.6 t Student Statistical Test
With the data presented, a statistical t Student test was carried out to determine if there are significant differences between the two groups of collected data (taken with the laser meter or taken with the structured light system proposed). This test was performed using the Excel data analysis tool, with a significance of 95% (that is, with an alpha of 0.05). For the test in question, two contexts were considered in the acquisition of the scene stairs; The first consisted of evaluating the similarity between the data taken, applied to the first line of stairs (Eb to Ea8), yielding the results presented in table 2. When developing this test, it was observed that its value is of 0.075225, and being greater than the value defined for alpha, it can be concluded that there is no evidence of a significant difference between the samples of the data taken in the first line of stairs with the two measurement systems used.The same procedure was developed considering all the stairs taken in the scene. The results are presented in table 3 and in this case the value of the test is less than that defined for alpha, which implies a difference that becomes significant between the values taken with the two measuring instruments.
Table 2: Results of the t Student test applied to the first line of the Stairs
scene
| First Line of Stairs | Depth with Implemented System (mm) | Depth with Laser meter (mm) |
|---|---|---|
| Mean | 563,2667 | 566,4444 |
| Observations | 9,0000 | 9,0000 |
| Pearson's correlation coefficient | 0,9887 | |
| Degrees of freedom | 8,0000 | |
| P(T<=t) two tails | 0,9887 | |
Table 3: Results of the t Student test applied to all samples of the Stairs scene
| First Line of Stairs | Depth with Implemented System (mm) | Depth with Laser meter (mm) |
|---|---|---|
| Mean | 614,5346 | 640,7308 |
| Observations | 26,0000 | 26,0000 |
| Pearson's correlation coefficient | 0,9965 | |
| Degrees of freedom | 25,0000 | |
| P(T<=t) two tails | 0,000009 | |
4. CONCLUSIONS
This project provides basic parameters that lead to the development of a depth map generation system, capable of being presented as an alternative to determine distances in a scene, generating a plane of Z values that can be used for subsequent applications where require the distances of the mentioned map.It can be concluded that the system presents a good response to scenes that have depth variations between 540mm to 640mm, presenting errors of less than 5.5% in the mentioned range. This error is gradual, corresponding to a second order polynomial trend curve, as the depth is greater.
The development of distance determination systems through depth maps presents a much more complete data alternative than that found when making measurements with single point digital laser measurement systems, since it allows generating more information on the various depths at multiple coordinate points in the scene.
It could be seen that the shadows generated by the scene itself generate areas where the bands of coded structured light cannot be interpreted. For this reason, wrong depth measurements can be generated over the shadow area.
The total processing time of the system is close to 42 seconds, investing a time close to 35 seconds in the process of generation and acquisition of sequences.
ACKNOWLEDGMENTS
Special thanks go to Dr Gabriel Taubin, Professor and Researcher in the Department of Engineering and Computer Science at Brown University. given that, thanks to his interest and attention in topics such as Applied Computational Geometry, Computer Graphics, Digital Geometry Processing, and Computer Vision; in a kind and disinterested way, he provided a large amount of information and codes that were used and adapted to carry out this work successfully.REFERENCES
Akleman, E., Xing, Q., Garigipati, P., Taubin, G., Chen, J., & Hu, S. (2015). Special Section on Expressive Graphics Hamiltonian cycle art: Surface covering wire sculptures and duotone surfaces. Computers and Graphics, 37, 316–332. https://doi.org/10.1016/j.cag.2013.01.004Andaló, F. A., Taubin, G., & Goldenstein, S. (2015). Efficient height measurements in single images based on the detection of vanishing points. Computer Vision and Image Understanding, 138, 51–60. https://doi.org/10.1016/j.cviu.2015.03.017
Avendano, J., Ramos, P. J. J., & Prieto, F. A. A. (2017). A system for classifying vegetative structures on coffee branches based on videos recorded in the field by a mobile device. Expert Systems with Applications, 88, 178–192. https://doi.org/10.1016/j.eswa.2017.06.044
Bouguet, J.-Y. (n.d.). Camera Calibration Toolbox for Matlab. Retrieved October 4, 2018, from http://www.vision.caltech.edu/bouguetj/calib_doc/
Falcao, G., Hurtos, N., & Massich, J. (2008). Plane-based calibration of a projector-camera system.
Godin, G., Hébert, P., Masuda, T., & Taubin, G. (n.d.). Special issue on new advances in 3D imaging and modeling. Computer Vision and Image Understanding, 113, 1105–1106. https://doi.org/10.1016/j.cviu.2009.09.007
Herrero-Huerta, M., González-Aguilera, D., Rodriguez-Gonzalvez, P., & Hernández-López, D. (2015). Vineyard yield estimation by automatic 3D bunch modelling in field conditions. Computers and Electronics in Agriculture, 110, 17–26. https://doi.org/10.1016/j.compag.2014.10.003
Ivorra Martínez, E. (2015). Desarrollo de técnicas de visión hiperespectral y tridimensional para el sector agroalimentario. Universidad Politécnica de Valencia.
Lanman, D., Crispell, D., & Taubin, G. (2009). Surround structured lighting: 3-D scanning with orthographic illumination. Computer Vision and Image Understanding, 113, 1107–1117. https://doi.org/10.1016/j.cviu.2009.03.016
Lanman, D., & Taubin, G. (2009). Build Your Own 3D Scanner : 3D Photography for Beginners. Siggraph, 94. https://doi.org/10.1145/1665817.1665819
Maurice, X., Graebling, P., & Doignon, C. (2011). Epipolar Based Structured Light Pattern Design for 3-D Reconstruction of Moving Surfaces. IEEE International Conference on Robotics and Automation Shanghai International Conference Center May 9-13, 2011, Shanghai, China, 5301–5308.
Mera, C., Orozco-Alzate, M., Branch, J., & Mery, D. (2016). Automatic visual inspection: An approach with multi-instance learning. Computers in Industry, 83, 46–54. https://doi.org/10.1016/j.compind.2016.09.002
Montalto, A., Graziosi, S., Bordegoni, M., & Di Landro, L. (2016). An inspection system to master dimensional and technological variability of fashion-related products: A case study in the eyewear industry. https://doi.org/10.1016/j.compind.2016.09.007
Oh, J., Lee, C., Lee, S., Jung, S., Kim, D., & Lee, S. (2010). Development of a Structured-light Sensor Based Bin-Picking System Using ICP Algorithm. International Conference on Control, Automation and Systems 2010, Oct. 27-30, 2010 in Kintex, Gyeonggi-Do, Korea, 1673–1677.
Pardo-Beainy, C., Gutiérrez-Cáceres, E., Pardo, D., Medina, M., & Jiménez, F. (2020). Sistema de Interacción con Kinect Aplicado a Manipulación de Procesos. Revista Colombiana de Tecnologías de Avanzada (RCTA), Ed. Especial, 11–16. https://doi.org/10.24054/16927257.VESPECIAL.NESPECIAL.2020.849
Parmehr, E. G., Fraser, C. S., Zhang, C., & Leach, J. (2014). Automatic registration of optical imagery with 3D LiDAR data using statistical similarity. ISPRS Journal of Photogrammetry and Remote Sensing, 88, 28–40. https://doi.org/10.1016/j.isprsjprs.2013.11.015
Saiz Muñoz, M. (2010). Reconstrucción Tridimensional Mediante Visión Estéreo y Técnicas de Optimización. Universidad Pontificia Comillas.
Verdú, S., Ivorra, E., Sánchez, A. J., Girón, J., Barat, J. M., & Grau, R. (2013). Comparison of TOF and SL techniques for in-line measurement of food item volume using animal and vegetable tissues. Food Control, 33(1), 221–226.
Young, M., Beeson, E., Davis, J., Rusinkiewicz, S., & Ramamoorthi, R. (2007). Viewpoint-Coded Structured Light. 2007 IEEE Conference on Computer Vision and Pattern Recognition, 1–8. https://doi.org/10.1109/CVPR.2007.383292
Zeng, Q., Martin, R. R., Wang, L., Quinn, J. A., Sun, Y., & Tu, C. (2014). Region-based bas-relief generation from a single image. Graphical Models, 76, 140–151. https://doi.org/10.1016/j.gmod.2013.10.001
Zhao, Y., & Taubin, G. (2011). Chapter 31 - Real-Time Stereo on GPGPU Using Progressive Multiresolution Adaptive Windows. GPU Computing Gems, 473–495. https://doi.org/10.1016/B978-0-12-384988-5.00031-0
Universidad de Pamplona
I. I. D. T. A.
I. I. D. T. A.